# 🌐 Local Tile Server for Geospatial Rasters
[](https://codecov.io/gh/banesullivan/flask-tileserver)
[](https://pypi.org/project/flask-tileserver/)
[](https://pypi.org/project/flask-tileserver/)
*Need to visualize a rather large (gigabytes) raster you have locally?* **This is for you.**
A Flask application for serving tiles from large raster files in
the [Slippy Maps standard](https://wiki.openstreetmap.org/wiki/Slippy_map_tilenames)
(i.e., `/zoom/x/y.png`)
**Disclaimer**: I put this together over a weekend and I'm definitely going to
change a few things moving forward to make it more stable/robust. This means
that things will most likely break between minor releases (I use the
`major.minor.patch` versioning scheme).
## 🌟 Highlights
- Create a local tile server for large geospatial images
- View local raster files with `ipyleaflet`
- Extract regions of interest (ROIs) interactively
Under the hood, this uses [`large_image`](https://github.com/girder/large_image)
to launch a tile server in a background thread which will serve raster imagery
to a tile viewer (see `ipyleaflet` examples below).
This tile server can efficiently deliver varying levels of detail of your
raster imagery to your viewer; it helps to have pre-tiled, Cloud Optimized
GeoTIFFs (COG), but no wories if not as `large_image` will tile and cache for
you when opening the raster.
There is an included, standalone web viewer leveraging
[CesiumJS](https://cesium.com/platform/cesiumjs/) and [GeoJS](https://opengeoscience.github.io/geojs/).
You can use the web viewer to select and extract regions of interest from rasters.
## ⬇️ Installation
Install from PyPI: https://pypi.org/project/flask-tileserver/
```
pip install flask-tileserver
```
### 📝 A Brief Note on Installing GDAL
GDAL can be a pain in the 🍑 to install, and you may want to handle GDAL
before installing `flask-tileserver`.
If on linux, I highly recommend using the [large_image_wheels](https://github.com/girder/large_image_wheels) from Kitware.
```
pip install --find-links=https://girder.github.io/large_image_wheels --no-cache GDAL
```
Otherwise, I recommend using `conda`:
```
conda install -c conda-forge GDAL
```
## 💭 Feedback
Please share your thoughts and questions on the [Discussions](https://github.com/banesullivan/flask-tileserver/discussions) board.
If you would like to report any bugs or make feature requests, please open an issue.
If filing a bug report, please share a scooby `Report`:
```py
import tileserver
print(tileserver.Report())
```
## 🚀 Usage
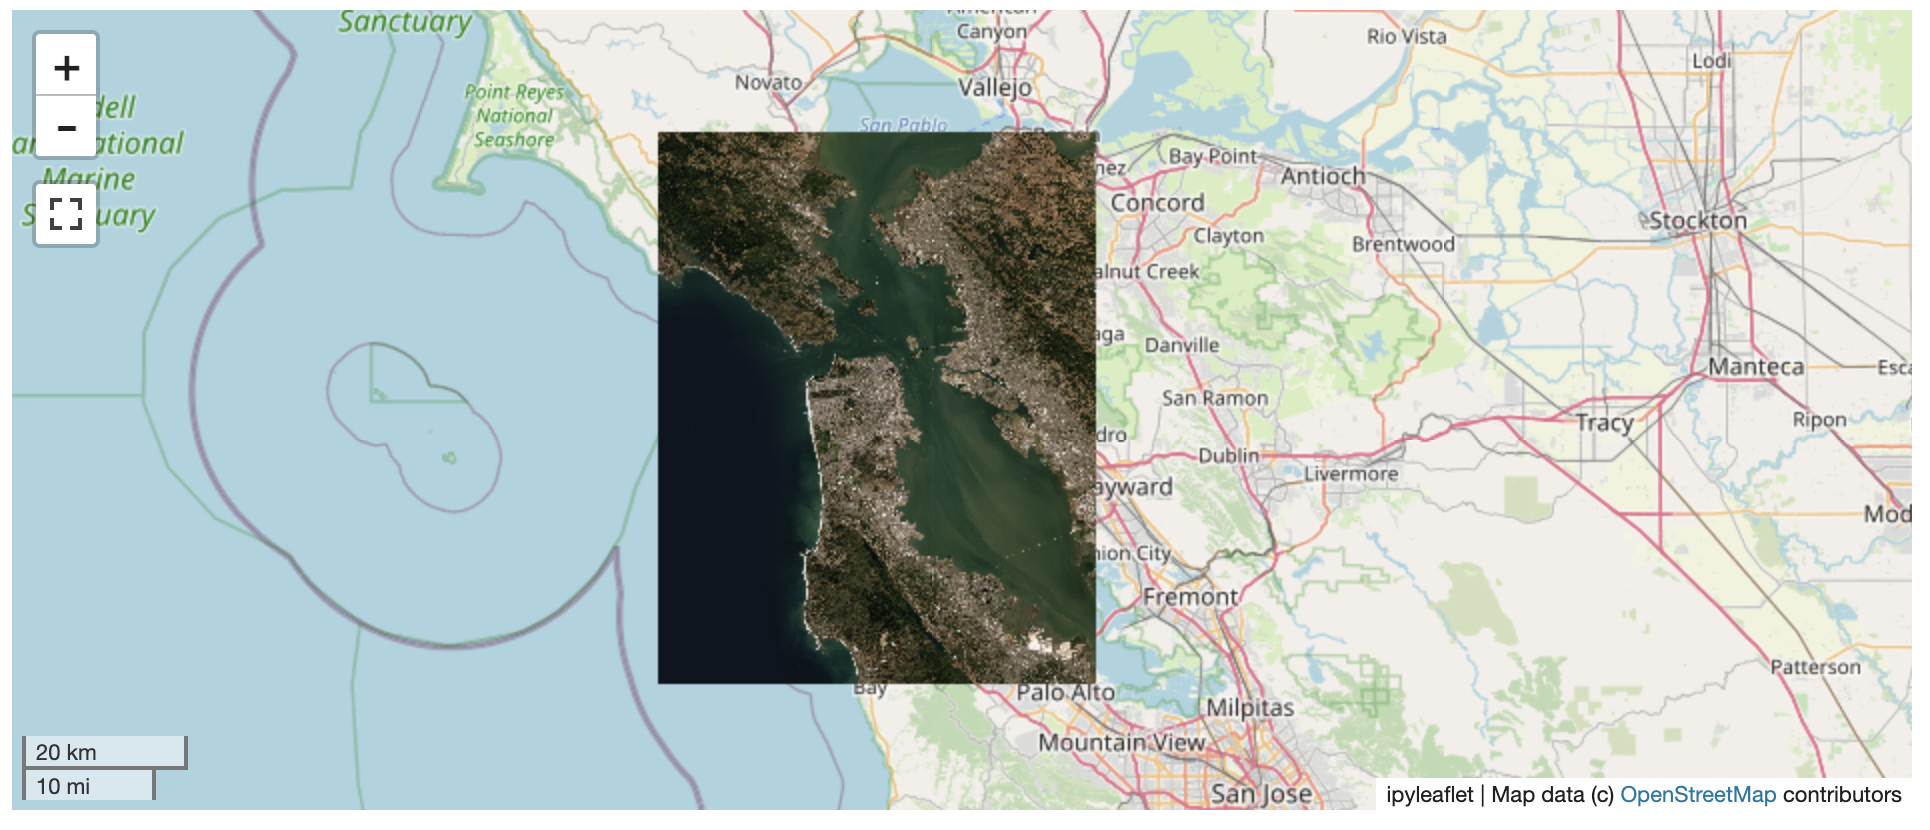
### 🍃 `ipyleaflet` Tile Layers
The `TileClient` class is a nifty tool to launch a tile server as a background
thread to serve image tiles from any raster file on your local file system.
Additionally, it can be used in conjunction with the `get_leaflet_tile_layer`
utility to create an `ipyleaflet.TileLayer` for interactive visualization in
a Jupyter notebook. Here is an example:
```py
from tileserver import get_leaflet_tile_layer, TileClient
from ipyleaflet import Map
# First, create a tile server from local raster file
tile_client = TileClient('~/Desktop/TC_NG_SFBay_US_Geo.tif')
# Create ipyleaflet tile layer from that server
t = get_leaflet_tile_layer(tile_client)
# Create ipyleaflet map, add tile layer, and display
m = Map(center=tile_client.center())
m.add_layer(t)
m
```
#### 🥓 Two Rasters at Once
```py
from tileserver import get_leaflet_tile_layer
from ipyleaflet import Map, ScaleControl, FullScreenControl, SplitMapControl
# Create 2 tile layers from 2 separate raster files
l = get_leaflet_tile_layer('~/Desktop/TC_NG_SFBay_US_Geo.tif',
band=1, palette='matplotlib.Viridis_20', vmin=50, vmax=200)
r = get_leaflet_tile_layer('~/Desktop/small.tif',
band=2, palette='matplotlib.Plasma_6', vmin=0, vmax=150)
# Make the ipyleaflet map
m = Map(center=(37.7249511580583, -122.27230466902257), zoom=9)
control = SplitMapControl(left_layer=l, right_layer=r)
m.add_control(control)
m.add_control(ScaleControl(position='bottomleft'))
m.add_control(FullScreenControl())
m
```
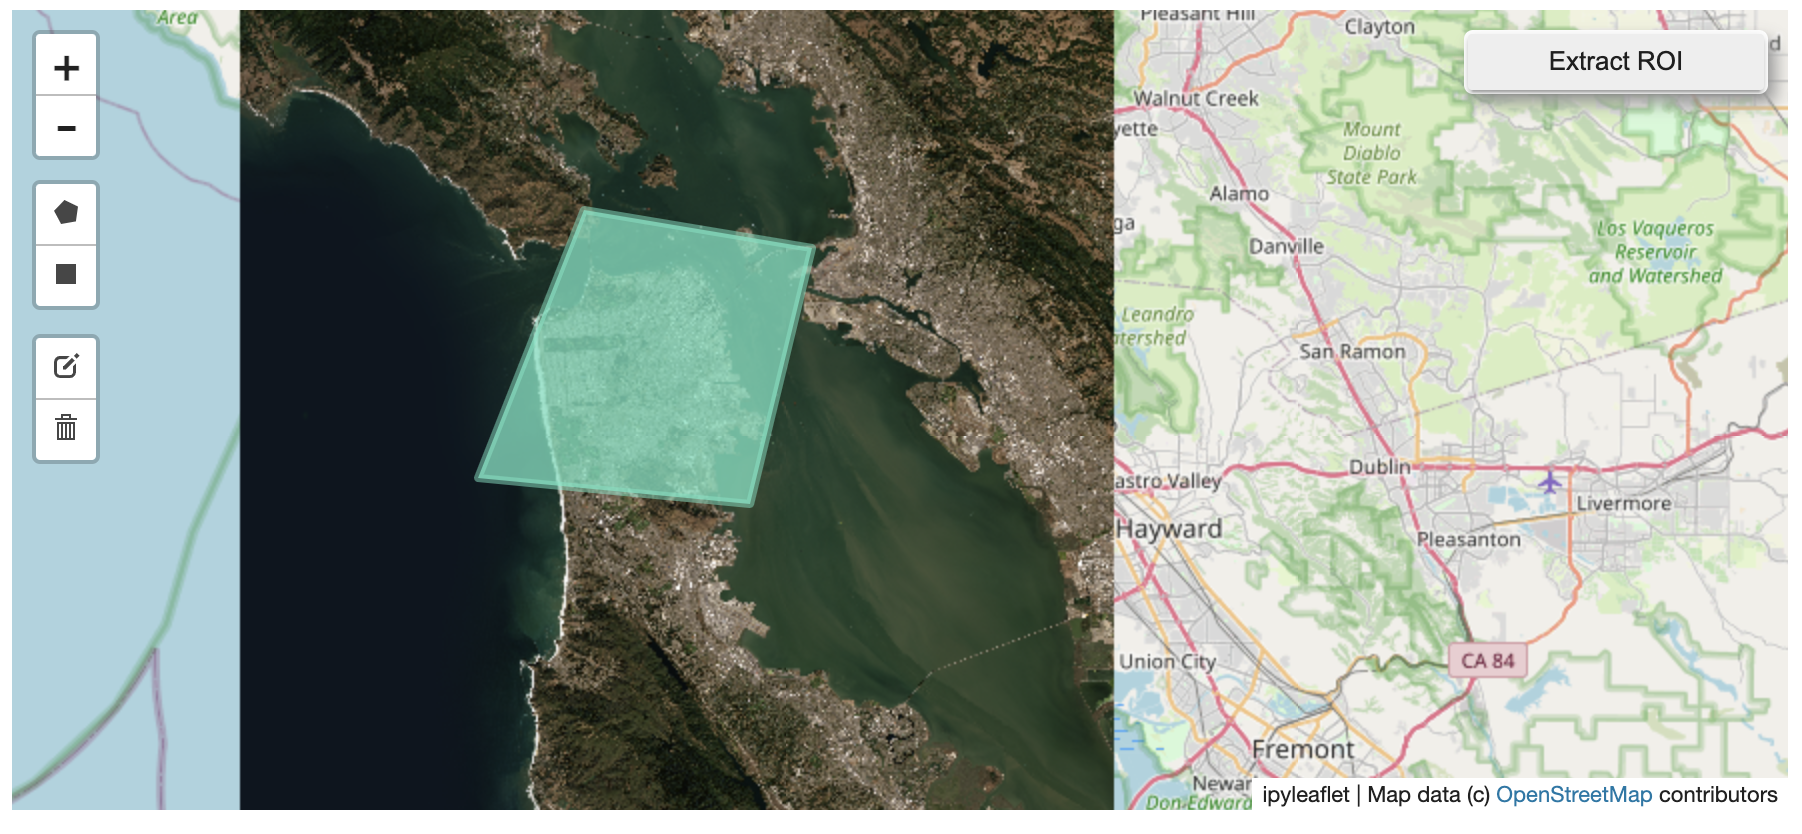
#### 🎯 Using `ipyleaflet` for ROI Extraction
I have included the `get_leaflet_roi_controls` utility to create some leaflet
UI controls for extracting regions of interest from a tile client. You can
use it as follows and then draw a polygon and click the "Extract ROI" button.
The outputs are save in your working directory by default (next to the Jupyter notebook).
```py
from tileserver import get_leaflet_tile_layer, get_leaflet_roi_controls
from tileserver import TileClient
from ipyleaflet import Map
# First, create a tile server from local raster file
tile_client = TileClient('~/Desktop/TC_NG_SFBay_US_Geo.tif')
# Create ipyleaflet tile layer from that server
t = get_leaflet_tile_layer(tile_client)
# Create ipyleaflet controls to extract an ROI
draw_control, roi_control = get_leaflet_roi_controls(tile_client)
# Create ipyleaflet map, add layers, add controls, and display
m = Map(center=(37.7249511580583, -122.27230466902257), zoom=9)
m.add_layer(t)
m.add_control(draw_control)
m.add_control(roi_control)
m
```
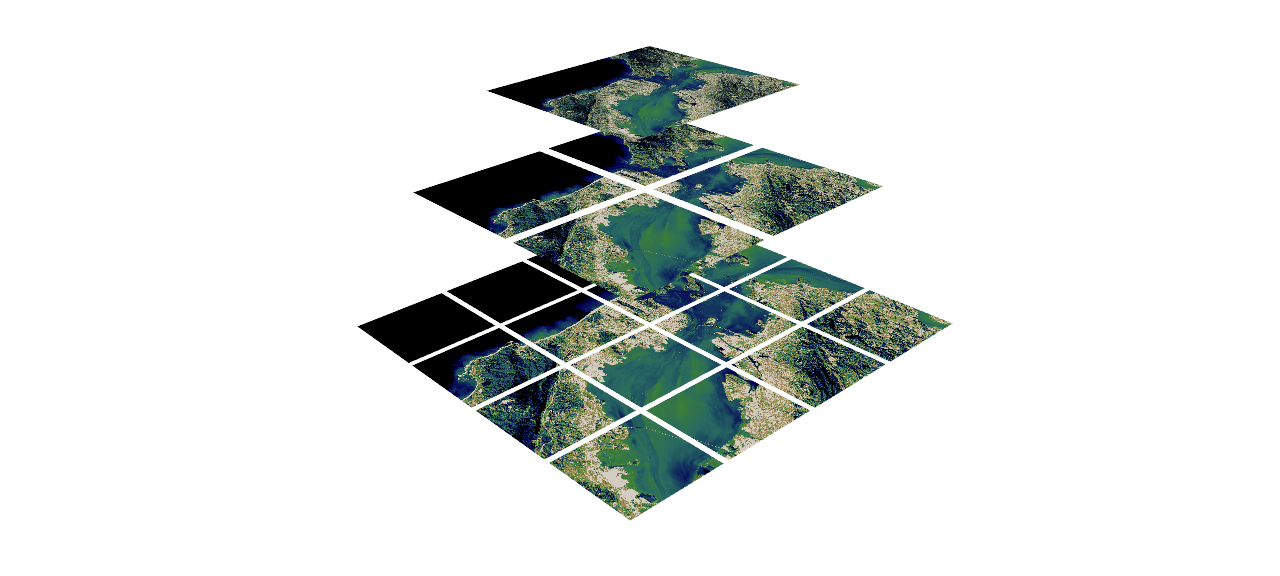
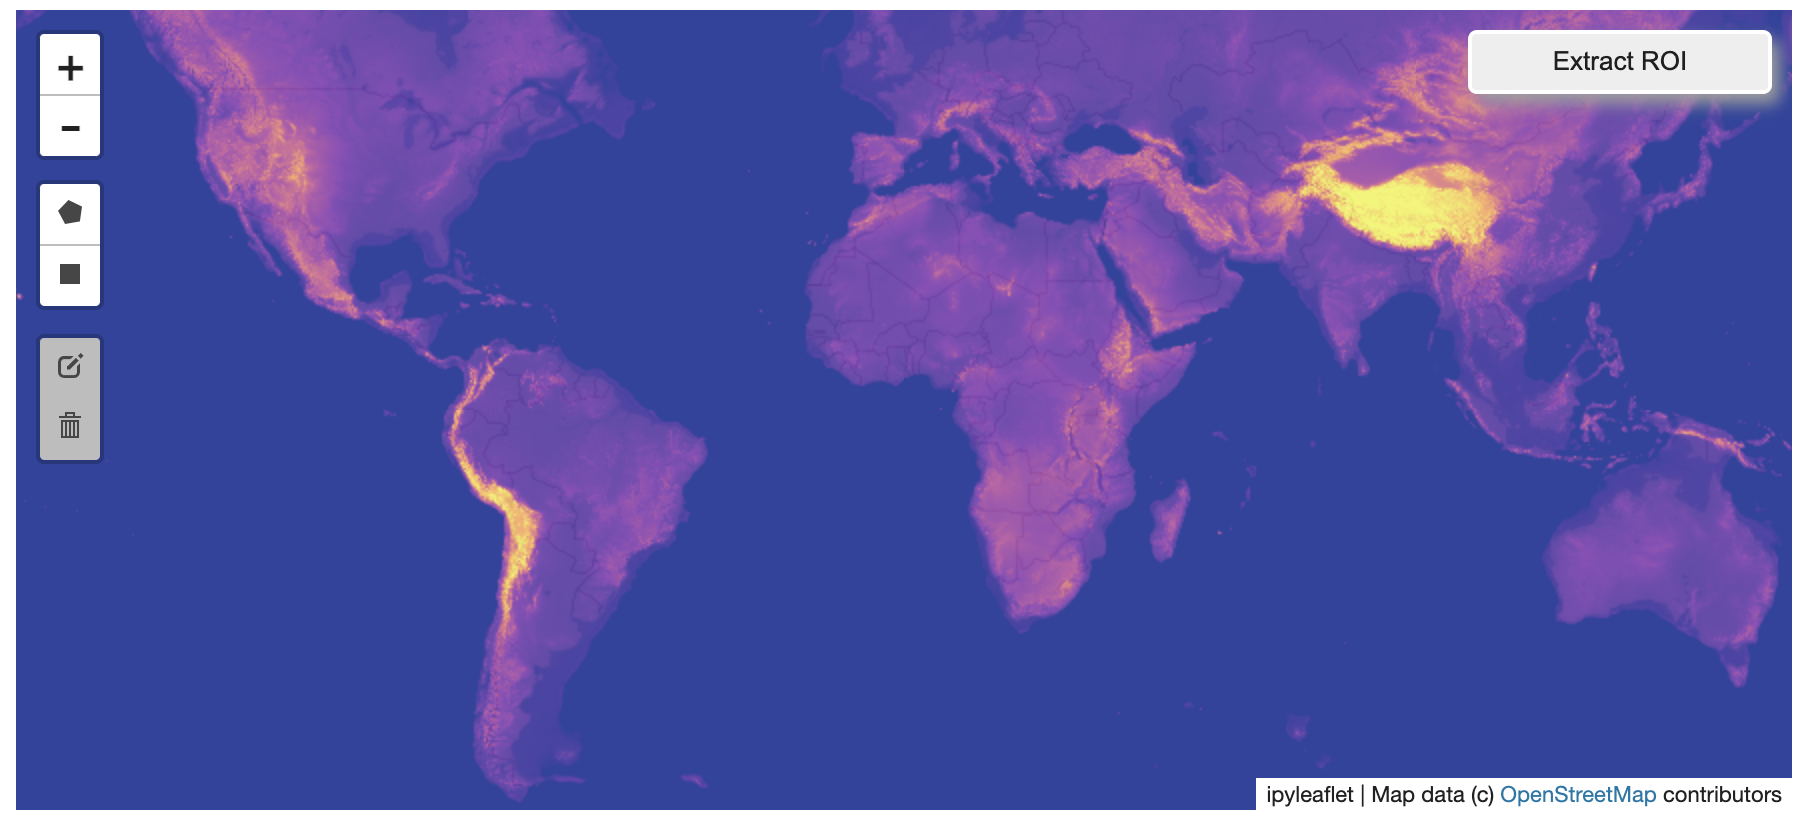
#### 🗺️ Example Datasets
A few example datasets are included with `tileserver`. A particularly
useful one has global elevation data which you can use to create high resolution Digital Elevation Models (DEMs) of a local region.
```py
from tileserver import get_leaflet_tile_layer, get_leaflet_roi_controls, examples
from ipyleaflet import Map
# Load example tile layer from publicly available DEM source
tile_client = examples.get_elevation()
# Create ipyleaflet tile layer from that server
t = get_leaflet_tile_layer(tile_client,
band=1, vmin=-500, vmax=5000,
palette='matplotlib.Plasma_6',
opacity=0.75)
# Create ipyleaflet controls to extract an ROI
draw_control, roi_control = get_leaflet_roi_controls(tile_client)
m = Map(zoom=2)
m.add_layer(t)
m.add_control(draw_control)
m.add_control(roi_control)
m
```
Then you can follow the same routine as described above to extract an ROI.
I zoomed in over Golden, Colorado and drew a polygon of the extent of the DEM I would like to create:
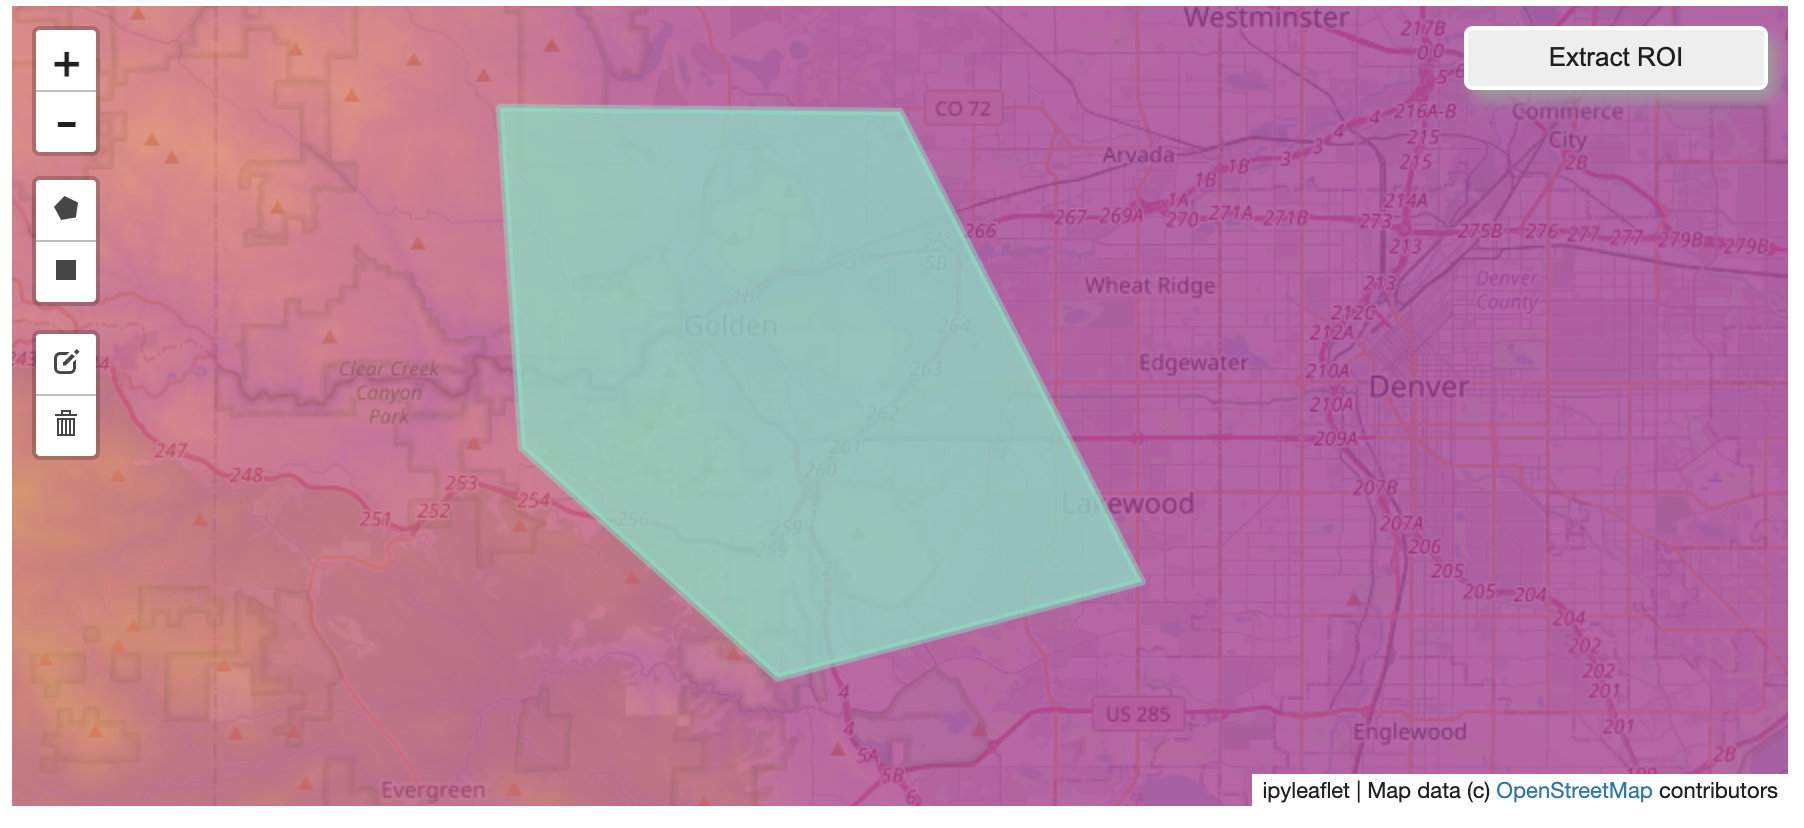
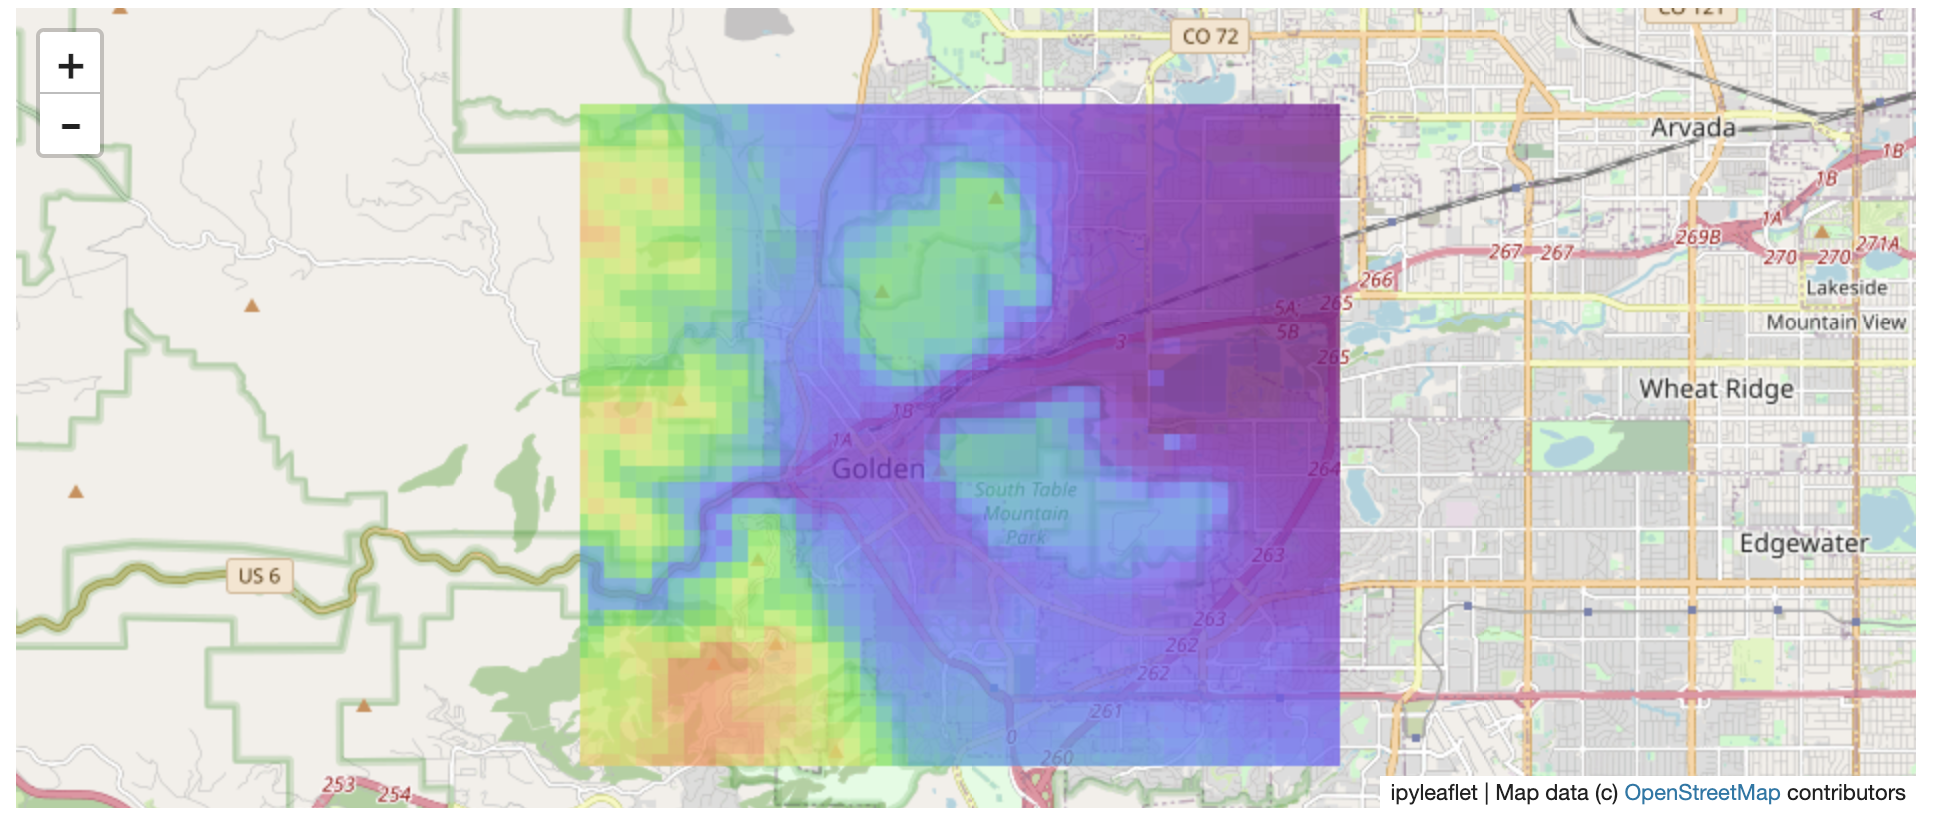
And perform the extraction:
```py
roi_path = '...' # Look in your working directory
r = get_leaflet_tile_layer(roi_path, band=1,
palette='matplotlib.Plasma_6', opacity=0.75)
m2 = Map(
center=(39.763427033262175, -105.20614908076823),
zoom=12,
)
m2.add_layer(r)
m2
```
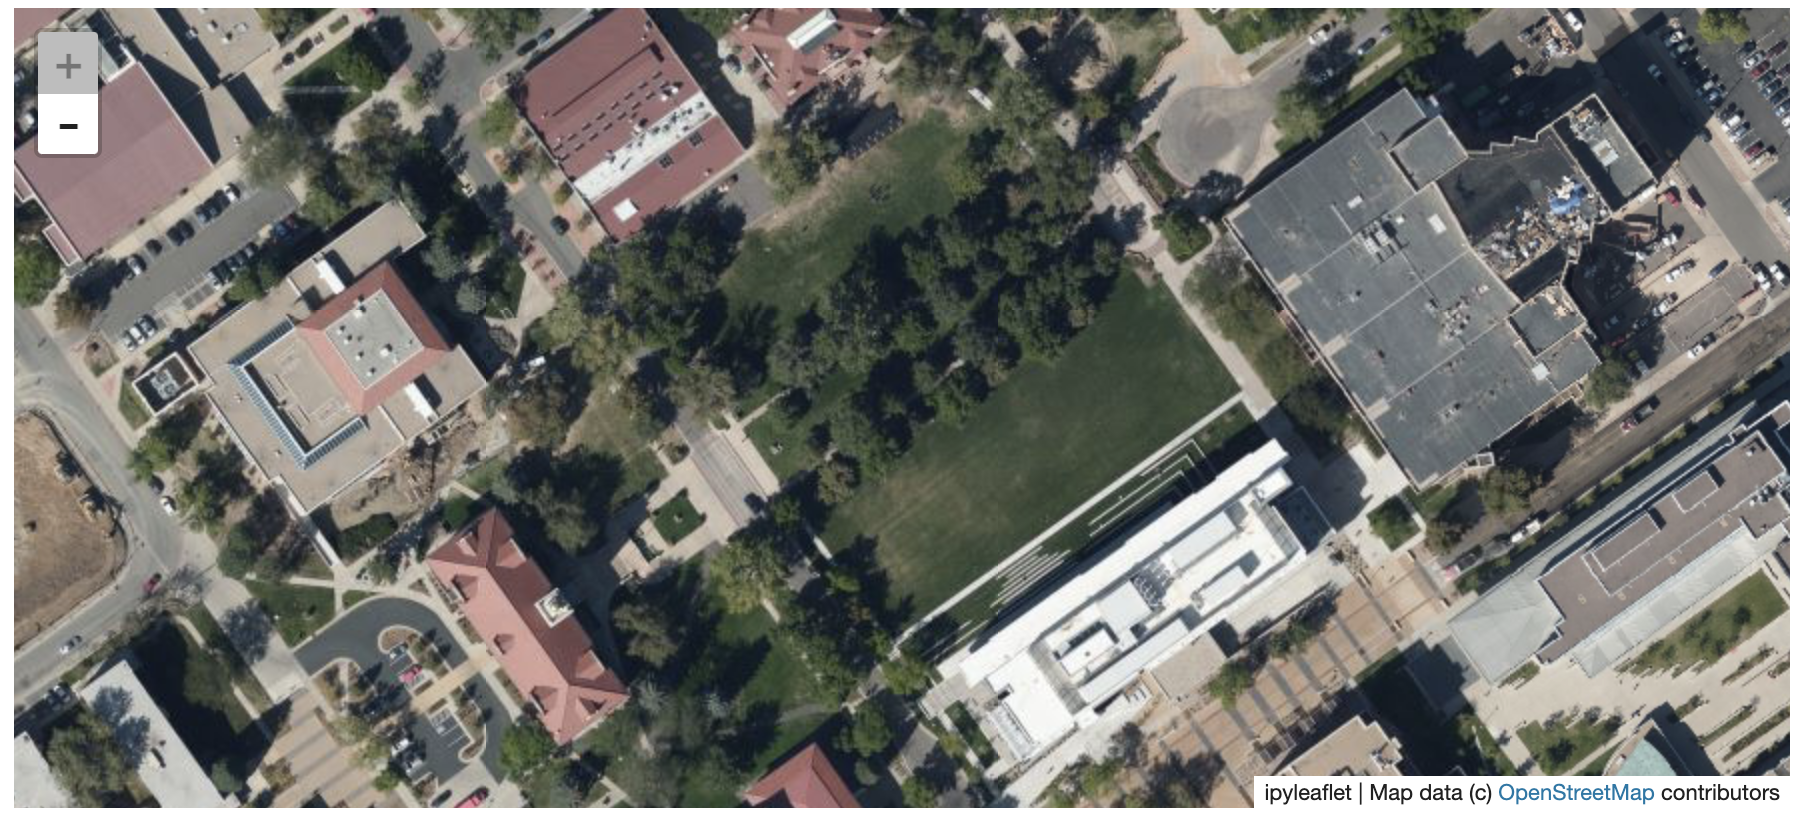
Here is another example with the Virtual Earth satellite imagery
```py
from tileserver import get_leaflet_tile_layer, examples
from ipyleaflet import Map
# Load example tile layer from publicly available imagery
tile_client = examples.get_virtual_earth()
# Create ipyleaflet tile layer from that server
t = get_leaflet_tile_layer(tile_client, opacity=1)
m = Map(center=(39.751343612695145, -105.22181306125279), zoom=18)
m.add_layer(t)
m
```
### 🖥️ Local Web Application
Launch the tileserver from the commandline to use the included web application where you can view the raster and extract regions of interest.
```bash
python -m tileserver path/to/raster.tif
```
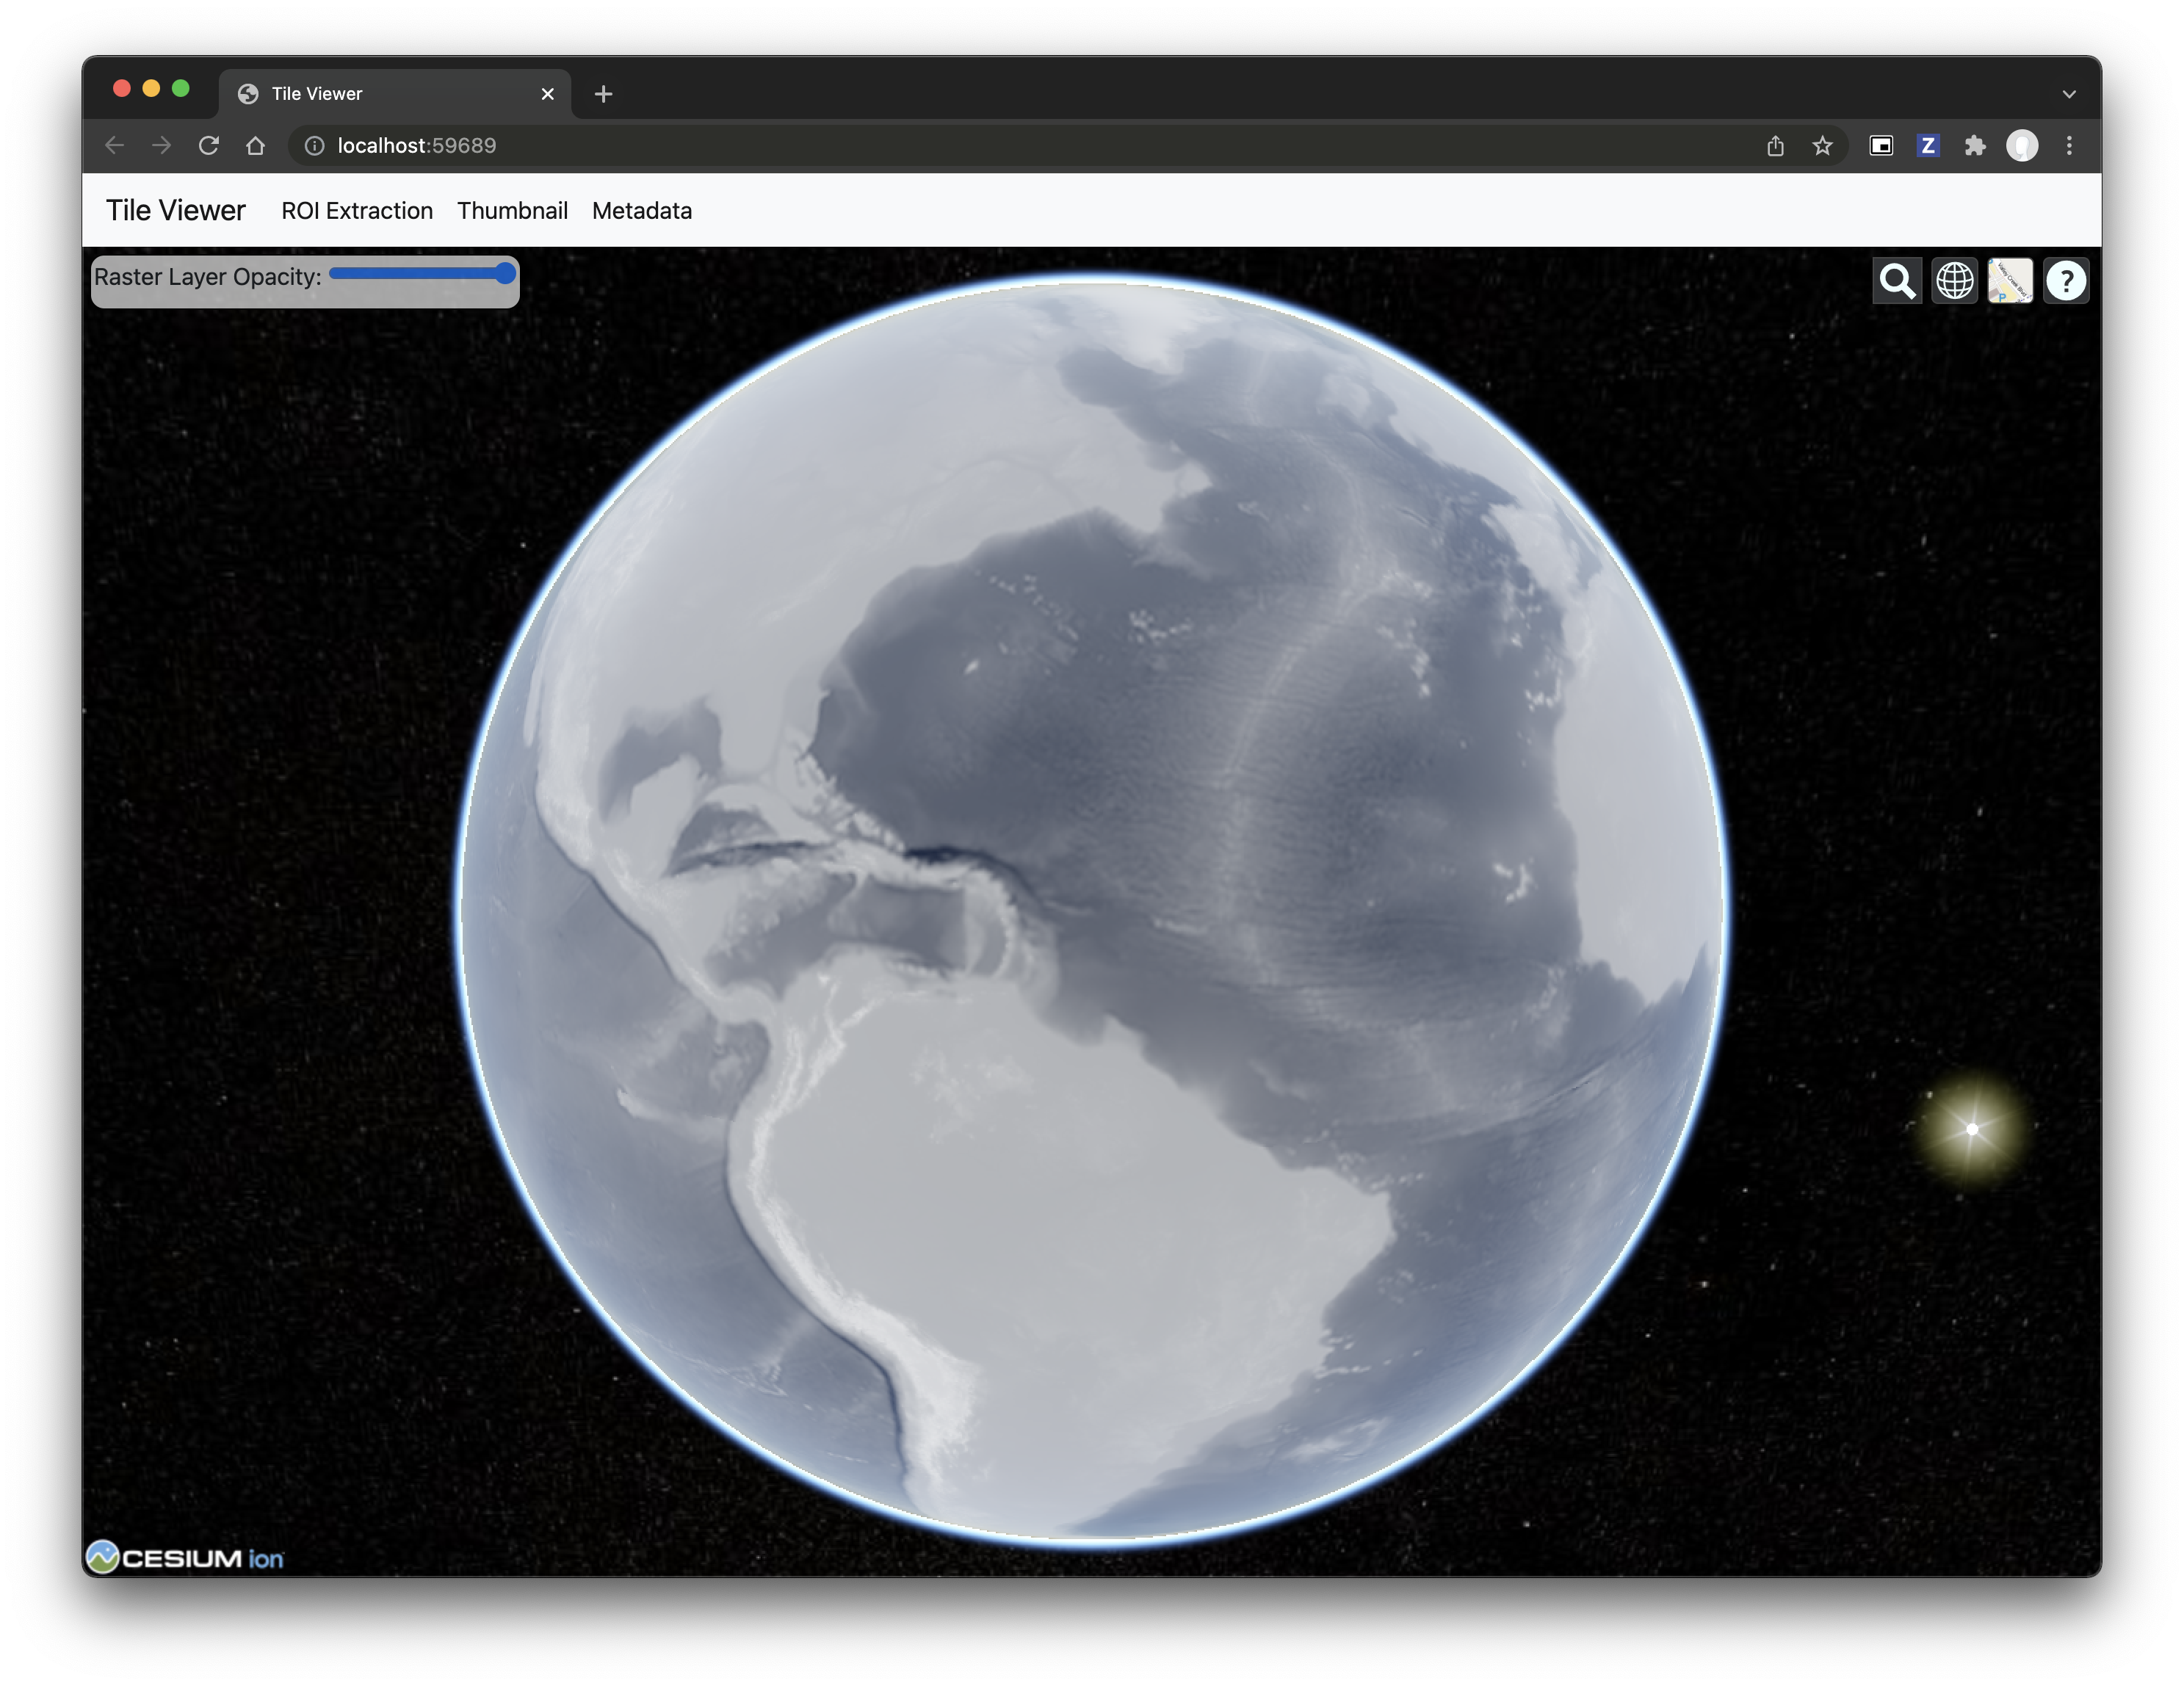
You can use the web viewer to extract regions of interest:
### Usage Notes
- `get_leaflet_tile_layer` accepts either an existing `TileClient` or a
path from which to create a `TileClient` under the hood.
- The color palette choices come from [`palettable`](https://jiffyclub.github.io/palettable/).


