# epiMuller README
##### About
###### Author
Jennifer L. Havens
###### Purpose
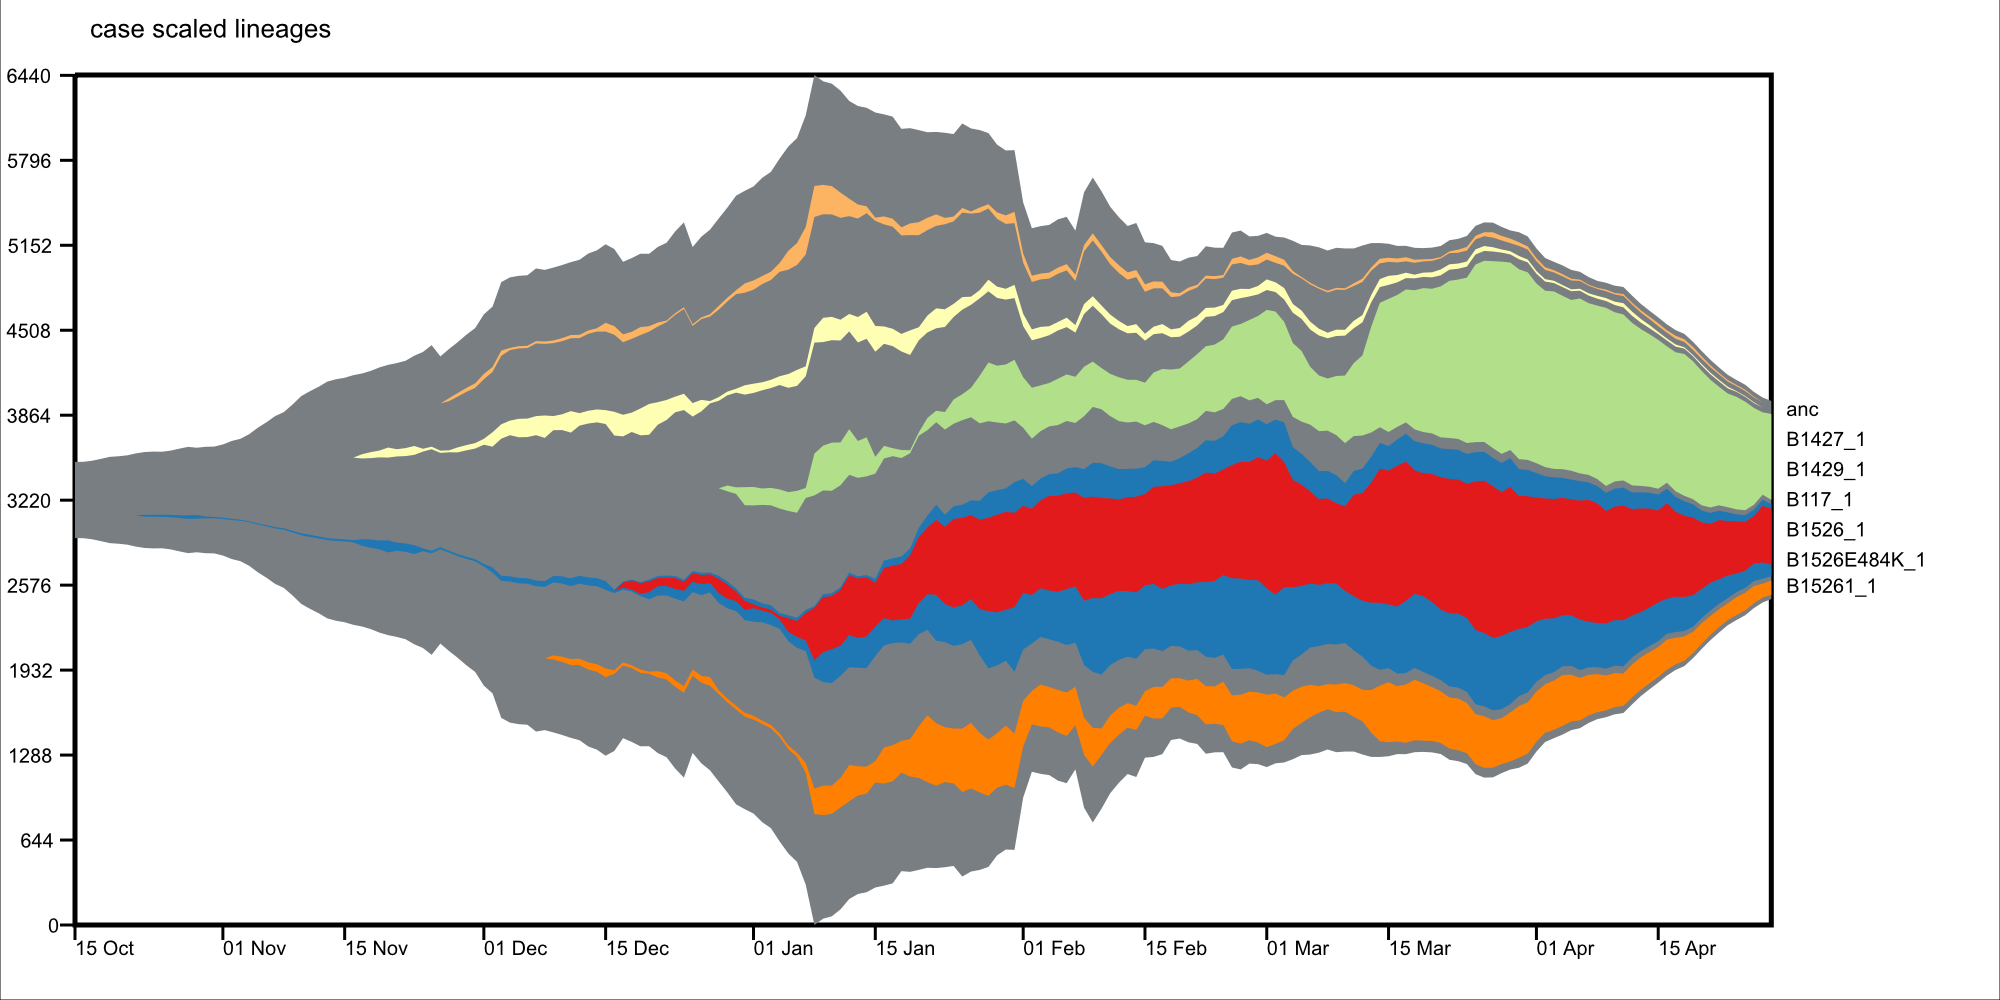
Visualize lineages overtime, with phylogentic context, based on viral genomes.
###### Language
Python3
###### Inputs
timetree, ancestral state reconstruction (Nextstain JSON file or annotated TreeTime nexus file), sample collection dates and, PANGO lineages (optional)
###### Workflow overview
- **epimuller-parse** (optional): parse fasta names with '*bar* isodate' suffix into usable fasta and metadata files.
- **epimuller**: wrapper for epimuller-define and epimuller-draw.
- **epimuller-define**: assigns samples to clades based on ancestral reconstruction of specified aa mutations or trait (hierarchy), and counts number of samples in a clade withen each time frame (abundance).
- **epimuller-draw**: plots the frequency clades overtime, as specifed by abundance and hierarchy inputs from epimuller-define.
###### Source code avaliblity
[gitHub](https://github.com/jennifer-bio/epimuller)
###### Documentation avaliblity
[Read the Docs](https://epimuller.readthedocs.io/en/stable/)
## Quick start
```
pip3 install epimuller
epimuller [-h] [-oDir OUTDIRECTORY] -oP OUTPREFIX
(-n INNEXTSTRAIN | -a ANNOTATEDTREE) -m
INMETA [-p INPANGOLIN] [--noPangolin]
[-k TRAITOFINTERSTKEY]
[-f TRAITOFINTERSTFILE] [-g GENEBOUNDRY]
[-mut VOCLIST [VOCLIST ...]]
[-t TIMEWINDOW]
[-s STARTDATE] [-e ENDDATE] [-mt MINTIME]
[-min MINTOTALCOUNT] [-c CASES_NAME]
[--avgWindow AVGWINDOW]
[-l {date,time,bimonthly}]
[-lp {Right,Max,Start,End}] [--WIDTH WIDTH]
[--HEIGHT HEIGHT] [--LEGENDWIDTH LEGENDWIDTH]
[--MARGIN MARGIN] [--FONTSIZE FONTSIZE]
[--LABELSHIFT LABELSHIFT]
```
## SOME EXAMPLES
#### Examples for full run
To see steps used to prep files for these examples look at scripts/Example_CommandsFromScratch.txt on [gitHub](https://github.com/jennifer-bio/epimuller/blob/main/scripts/Example_CommandsFromScratch.txt).
##### Visulize default aa mutation list
```
epimuller \
-n inputData/GISAID_NYCPHL_04_29/02_nextstrainResults \
-m inputData/GISAID_NYCPHL_04_29/gisaid_2021_04_30_00_rename.tsv \
-oDir 03_results_NYCPHL_April29 \
-oP 01_defaultAAList \
-c inputData/CITY_US-NY_NYC_outbreakinfo_epidemiology_data_2021-04-30.tsv
```
##### Visulize a trait: lineage
```
epimuller \
-n inputData/GISAID_NYCPHL_04_29/02_nextstrainResults \
-m inputData/GISAID_NYCPHL_04_29/gisaid_2021_04_30_00_rename.tsv \
-oDir 03_results_NYCPHL_April29 \
-oP 02_pangolin \
-c inputData/CITY_US-NY_NYC_outbreakinfo_epidemiology_data_2021-04-30.tsv \
--traitOfInterstFile traits.json \
--traitOfInterstKey lineage \
-lp Max \
-min 100 \
```
##### Visulize your own aa mutation list
```
epimuller \
-n inputData/GISAID_NYCPHL_04_29/02_nextstrainResults \
-m inputData/GISAID_NYCPHL_04_29/gisaid_2021_04_30_00_rename.tsv \
-oDir 03_results_NYCPHL_April29 \
-oP 03_selectedAA \
-c inputData/CITY_US-NY_NYC_outbreakinfo_epidemiology_data_2021-04-30.tsv \
-mut 'SE484K' 'S*452*' \
-min 50 \
-mt 20
```
##### Visulize default aa mutation list with TreeTime input
```
epimuller \
-a inputData/GISAID_NYCPHL_04_29/06_treetimeDates_aa/timetree.nexus \
-oDir 04_results_NYCPHL_April29 \
-oP defaultAA_treetime \
-m inputData/GISAID_NYCPHL_04_29/gisaid_2021_04_30_00_rename.tsv \
-g data/geneAAboundries.json \
--FONTSIZE 18
```
##### Visulize a trait: lineage with TreeTime input
```
epimuller \
-a inputData/GISAID_NYCPHL_04_29/06_treetimeDates_aa/timetree.nexus \
-oDir 03_results_NYCPHL_April29 \
-oP 05_pangolin_treetime \
-m inputData/GISAID_NYCPHL_04_29/gisaid_2021_04_30_00_rename.tsv \
--traitOfInterstKey lineage \
--noPangolin #does not label with mode of pangolin lineages in clade, label clade with defining lineage only
```
## Known edge cases / featrues to add
Known edge cases which are not correctly dealt with or features I intend to address (eventually).
If you run into anything else please let me know with an issue on [gitHub](https://github.com/jennifer-bio/epimuller/issues).
```
- feel free to ignore the undefined.svg that gets made - it is related to checking the size of the text to space out labels
- allow combination of aa mutants, not just 1
- define polytomy behavior
- option for user defined col names in metadata
- auto detect
```
## Addtional features
##### Color
If you would like to specify color for clade: in --parentHierarchy_name file (of epimuller-draw/drawMuller.py input) add col with name: "color" and hex color value (starting with #) for clades you want to specify.
##### Parse GISAID fasta for metadata
epimuller-parse
If you have downloaded sequences from GISAID under the search tab, you can parse out the names into a metadata file (format tested as of 2021-04-30).
## epimuller arguments
```
epimuller [-h] [-oDir OUTDIRECTORY] -oP OUTPREFIX
(-n INNEXTSTRAIN | -a ANNOTATEDTREE) -m
INMETA [-p INPANGOLIN] [--noPangolin]
[-k TRAITOFINTERSTKEY]
[-f TRAITOFINTERSTFILE] [-g GENEBOUNDRY]
[-mut VOCLIST [VOCLIST ...]]
[-t TIMEWINDOW]
[-s STARTDATE] [-e ENDDATE] [-mt MINTIME]
[-min MINTOTALCOUNT] [-c CASES_NAME]
[--avgWindow AVGWINDOW]
[-l {date,time,bimonthly}]
[-lp {Right,Max,Start,End}] [--WIDTH WIDTH]
[--HEIGHT HEIGHT] [--LEGENDWIDTH LEGENDWIDTH]
[--MARGIN MARGIN] [--FONTSIZE FONTSIZE]
[--LABELSHIFT LABELSHIFT]
arguments:
-h, --help show this help message and exit
-n INNEXTSTRAIN, --inNextstrain INNEXTSTRAIN
nextstrain results with tree.nwk and
[traitOfInterst].json (default: None)
-a ANNOTATEDTREE, --annotatedTree ANNOTATEDTREE
nexus file name with annotation:
[&!traitOfInterst=value], as output by treetime
(default: None)
Options for full repot:
-oDir OUTDIRECTORY, --outDirectory OUTDIRECTORY
folder for output (default: ./)
-oP OUTPREFIX, --outPrefix OUTPREFIX
prefix of out files withen outDirectory (default:
None)
Options passed to epimuller-define:
-m INMETA, --inMeta INMETA
metadata tsv with 'strain' and 'date'cols, optional:
cols of trait of interst; and pangolin col
named:'pangolin_lineage', 'lineage' or 'pangolin_lin'
(default: None)
-p INPANGOLIN, --inPangolin INPANGOLIN
pangolin output lineage_report.csv file, if argument
not supplied looks in inMeta for col with
'pangolin_lineage', 'pangolin_lin', or 'lineage'
(default: metadata)
--noPangolin do not add lineage to clade names (default: False)
-k TRAITOFINTERSTKEY, --traitOfInterstKey TRAITOFINTERSTKEY
key for trait of interst in json file OR (if
-a/--annotatedTree AND key is mutations with aa (not
nuc): use 'aa_muts') (default: aa_muts)
-f TRAITOFINTERSTFILE, --traitOfInterstFile TRAITOFINTERSTFILE
[use with -n/--inNextstrain] name of
[traitOfInterstFile].json in '-n/--inNextstrain'
folder (default: aa_muts.json)
-g GENEBOUNDRY, --geneBoundry GENEBOUNDRY
[use with -a/--annotatedTree AND -k/--traitOfInterst
aa_muts] json formated file specifing start end
postions of genes in alignment for annotatedTree (see
example data/geneAAboundries.json) (default: None)
-mut VOCLIST [VOCLIST ...], --VOClist VOCLIST [VOCLIST ...]
list of aa of interest in form
[GENE][*ORAncAA][site][*ORtoAA] ex. S*501*, gaps
represed by X, wild card aa represented by * (default:
None)
-t TIMEWINDOW, --timeWindow TIMEWINDOW
number of days for sampling window (default: 7)
-s STARTDATE, --startDate STARTDATE
start date in iso format YYYY-MM-DD or 'firstDate'
which sets start date to first date in metadata
(default: 2020-03-01)
-e ENDDATE, --endDate ENDDATE
end date in iso format YYYY-MM-DD or 'lastDate' which
sets end date as last date in metadata (default:
lastDate)
Options passed to epimuller-draw:
-mt MINTIME, --MINTIME MINTIME
minimum time point to start plotting (default: 30)
-min MINTOTALCOUNT, --MINTOTALCOUNT MINTOTALCOUNT
minimum total count for group to be included (default:
50)
-c CASES_NAME, --cases_name CASES_NAME
file with cases - formated with 'date' in ISO format
and 'confirmed_rolling' cases, in tsv format (default:
None)
--avgWindow AVGWINDOW
width of rolling mean window in terms of
--timeWindow's (recomend using with small
--timeWindow) ; default: sum of counts withen
timeWindow (ie no average) (default: None)
-l {date,time,bimonthly}, --xlabel {date,time,bimonthly}
Format of x axis label: ISO date format or timepoints
from start, or dd-Mon-YYYY on 1st and 15th (default:
date)
-lp {Right,Max,Start,End}, --labelPosition {Right,Max,Start,End}
choose position of clade labels (default: Right)
Options passed to epimuller-draw for page setup:
--WIDTH WIDTH WIDTH of page (px) (default: 1500)
--HEIGHT HEIGHT HEIGHT of page (px) (default: 1000)
--LEGENDWIDTH LEGENDWIDTH
LEGENDWIDTH to the right of plotting area (px)
(default: 220)
--MARGIN MARGIN MARGIN around all sides of plotting area (px)
(default: 60)
--FONTSIZE FONTSIZE
--LABELSHIFT LABELSHIFT
nudge label over by LABELSHIFT (px) (default: 15)
```
## epimuller-define: make abundance and hiearchy files
```
epimuller-define [-h] [-oDir OUTDIRECTORY] -oP OUTPREFIX
(-n INNEXTSTRAIN | -a ANNOTATEDTREE) -m INMETA
[-p INPANGOLIN] [--noPangolin]
[-k TRAITOFINTERSTKEY] [-f TRAITOFINTERSTFILE]
[-g GENEBOUNDRY] [-mut VOCLIST [VOCLIST ...]]
[-t TIMEWINDOW]
[-s STARTDATE] [-e ENDDATE]
optional arguments:
-h, --help show this help message and exit
-oDir OUTDIRECTORY, --outDirectory OUTDIRECTORY
folder for output (default: ./)
-oP OUTPREFIX, --outPrefix OUTPREFIX
prefix of out files withen outDirectory (default:
None)
-n INNEXTSTRAIN, --inNextstrain INNEXTSTRAIN
nextstrain results with tree.nwk and
[traitOfInterstFile].json (default: None)
-a ANNOTATEDTREE, --annotatedTree ANNOTATEDTREE
nexus file name with annotation:
[&!traitOfInterstKey=value], as output by treetime
(default: None)
-m INMETA, --inMeta INMETA
metadata tsv with 'strain' and 'date'cols, optional:
col for [traitOfInterstKey]; and pangolin col named:
'pangolin_lineage' 'lineage' or 'pangolin_lin'
(default: None)
-p INPANGOLIN, --inPangolin INPANGOLIN
pangolin output lineage_report.csv file, if argument
not supplied looks in inMeta for col with
'pangolin_lineage', 'pangolin_lin', or 'lineage'
(default: metadata)
--noPangolin do not add lineage to clade names (default: False)
-k TRAITOFINTERSTKEY, --traitOfInterstKey TRAITOFINTERSTKEY
key for trait of interst in json file OR (if
-a/--annotatedTree AND key is mutations with aa (not
nuc): use 'aa_muts') (default: aa_muts)
-f TRAITOFINTERSTFILE, --traitOfInterstFile TRAITOFINTERSTFILE
[use with -n/--inNextstrain] name of
[traitOfInterstFile].json in '-n/--inNextstrain'
folder (default: aa_muts.json)
-g GENEBOUNDRY, --geneBoundry GENEBOUNDRY
[use with -a/--annotatedTree AND -k/--traitOfInterst
aa_muts] json formated file specifing start end
postions of genes in alignment for annotatedTree (see
example data/geneAAboundries.json) (default: None)
-mut VOCLIST [VOCLIST ...], --VOClist VOCLIST [VOCLIST ...]
list of aa of interest in form
[GENE][*ORAncAA][site][*ORtoAA] ex. S*501*, gaps
represented by X, wild card aa represented by *
(default: None)
-t TIMEWINDOW, --timeWindow TIMEWINDOW
number of days for sampling window (default: 7)
-s STARTDATE, --startDate STARTDATE
start date in iso format YYYY-MM-DD or 'firstDate'
which is in metadata (default: 2020-03-01)
-e ENDDATE, --endDate ENDDATE
end date in iso format YYYY-MM-DD or 'lastDate' which
is in metadata (default: lastDate)
```
## epimuller-draw: plot
```
epimuller-draw [-h] -p PARENTHIERARCHY_NAME -a ABUNDANCE_NAME
[-c CASES_NAME] [--avgWindow AVGWINDOW] -o OUTFOLDER
[-mt MINTIME] [-min MINTOTALCOUNT]
[-l {date,time,bimonthly}] [-lp {Right,Max,Start,End}]
[--WIDTH WIDTH] [--HEIGHT HEIGHT]
[--LEGENDWIDTH LEGENDWIDTH] [--LABELSHIFT LABELSHIFT]
[--MARGIN MARGIN] [--FONTSIZE FONTSIZE]
arguments:
-h, --help show this help message and exit
-p PARENTHIERARCHY_NAME, --parentHierarchy_name PARENTHIERARCHY_NAME
csv output from mutationLinages_report.py with child
parent col (default: None)
-a ABUNDANCE_NAME, --abundance_name ABUNDANCE_NAME
csv output from mutationLinages_report.py with
abundances of clades (default: None)
-c CASES_NAME, --cases_name CASES_NAME
file with cases - formated with 'date' in ISO format
and 'confirmed_rolling' cases, in tsv format (default:
None)
--avgWindow AVGWINDOW
width of rolling mean window in terms of
--timeWindow's (recomend using with small
--timeWindow) ; default: sum of counts withen
timeWindow (ie no average) (default: None)
-o OUTFOLDER, --outFolder OUTFOLDER
csv output from mutationLinages_report.py with child
parent col (default: None)
-mt MINTIME, --MINTIME MINTIME
minimum time point to start plotting (default: 30)
-min MINTOTALCOUNT, --MINTOTALCOUNT MINTOTALCOUNT
minimum total count for group to be included (default:
50)
-l {date,time,bimonthly}, --xlabel {date,time,bimonthly}
Format of x axis label: ISO date format or timepoints
from start, or dd-Mon-YYYY on 1st and 15th (default:
date)
-lp {Right,Max,Start,End}, --labelPosition {Right,Max,Start,End}
choose position of clade labels (default: Right)
Options for page setup:
--WIDTH WIDTH WIDTH of page (px) (default: 1500)
--HEIGHT HEIGHT HEIGHT of page (px) (default: 1000)
--LEGENDWIDTH LEGENDWIDTH
LEGENDWIDTH to the right of plotting area (px)
(default: 220)
--LABELSHIFT LABELSHIFT
nudge label over by LABELSHIFT (px) (default: 15)
--MARGIN MARGIN MARGIN around all sides of plotting area (px)
(default: 60)
--FONTSIZE FONTSIZE
```
## Install methods
##### With Bioconda
```
conda install -c bioconda epimuller
```
##### With pip
```
pip3 install epimuller
#If there is an issue with cairo, try:
pip3 install pycairo
pip3 install epimuller
```
##### From source
Download source code from [gitHub](https://github.com/jennifer-bio/epimuller) or [pypi](https://pypi.org/project/epimuller/)
```
#open as needed for download format
tar -zxvf epimuller-[version].tar.gz
cd epimuller-[version]
python3 setup.py install
```
##### Run scripts directly
Note you will have to install all dependencies.
Download source code from [gitHub](https://github.com/jennifer-bio/epimuller) or [pypi](https://pypi.org/project/epimuller/)
```
#open as needed for download format
tar -zxvf epimuller-[version].tar.gz
cd epimuller-[version]
#to run epimuller
python3 ./scripts/mutationLinages_report.py [arugments]
#to run epimuller-parse
python3 ./scripts/parseFastaNames.py [arugments]
#to run epimuller-define
python3 ./scripts/defineAndCountClades.py [arugments]
#to run epimuller-draw
python3 ./scripts/drawMuller.py [arugments]
```
## Citation
Please [link to this github](https://github.com/jennifer-bio/epimuller) if you have used epimuller in your research.
#### Extra notes on GISAID
If you do use GISAID data please acknowledge the contributers, such as with [language suggested by GISAID](https://www.gisaid.org/help/publish-with-data-from-gisaid/).


