# dx
<p align="center">
This package provides convenient formatting and IPython display formatter registration for tabular data and DEX media types.
</p>
<p align="center">
<a href="https://github.com/noteable-io/dx/actions/workflows/ci.yaml">
<img src="https://github.com/noteable-io/dx/actions/workflows/ci.yaml/badge.svg" alt="CI" />
</a>
<a href="https://codecov.io/gh/noteable-io/dx" >
<img src="https://codecov.io/gh/noteable-io/dx/branch/main/graph/badge.svg?token=XGXSTD3GSI" alt="codecov code coverage"/>
</a>
<img alt="PyPI - License" src="https://img.shields.io/pypi/l/dx" />
<img alt="PyPI - Python Version" src="https://img.shields.io/pypi/pyversions/dx" />
<img alt="PyPI" src="https://img.shields.io/pypi/v/dx">
<a href="https://github.com/psf/black"><img alt="Code style: black" src="https://img.shields.io/badge/code%20style-black-000000.svg"></a>
</p>
---------
A Pythonic Data Explorer, open sourced with ❤️ by <a href="https://noteable.io">Noteable</a>, a collaborative notebook platform that enables teams to use and visualize data, together.
## Requirements
Python 3.8+
## Installation
### Poetry
```shell
poetry add dx
```
Then import the package:
```python
import dx
```
### Pip
```shell
pip install dx
```
Then import the package:
```python
import dx
```
## Usage
The `dx` library currently enables DEX media type visualization of pandas `DataFrame` and `Series` objects, as well as numpy `ndarray` objects. This can be handled in two ways:
- explicit `dx.display()` calls
- setting the `display_mode` to update the IPython display formatter for a session
### With `dx.display()`
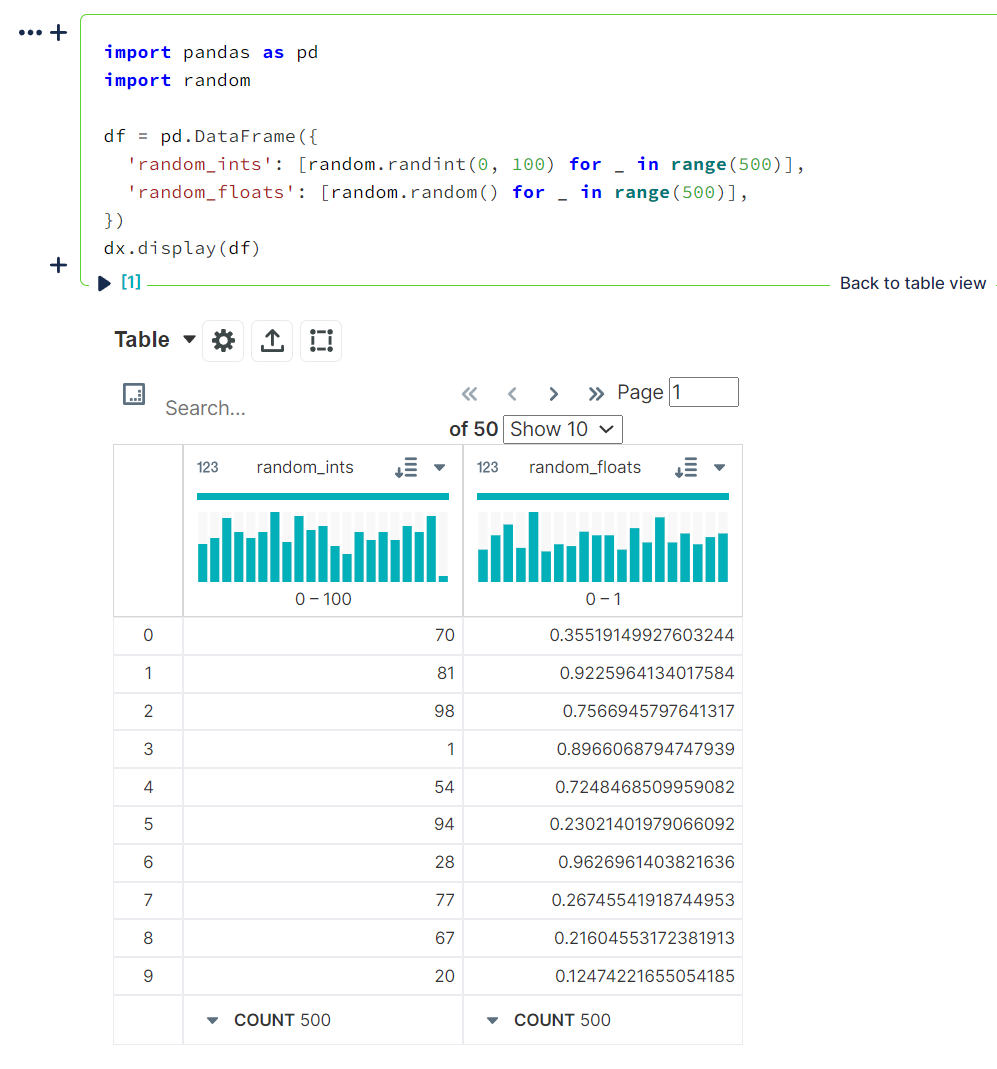
`dx.display()` will display a single dataset using the DEX media type. It currently supports:
- pandas `DataFrame` objects
```python
import pandas as pd
import random
df = pd.DataFrame({
'random_ints': [random.randint(0, 100) for _ in range(500)],
'random_floats': [random.random() for _ in range(500)],
})
dx.display(df)
```
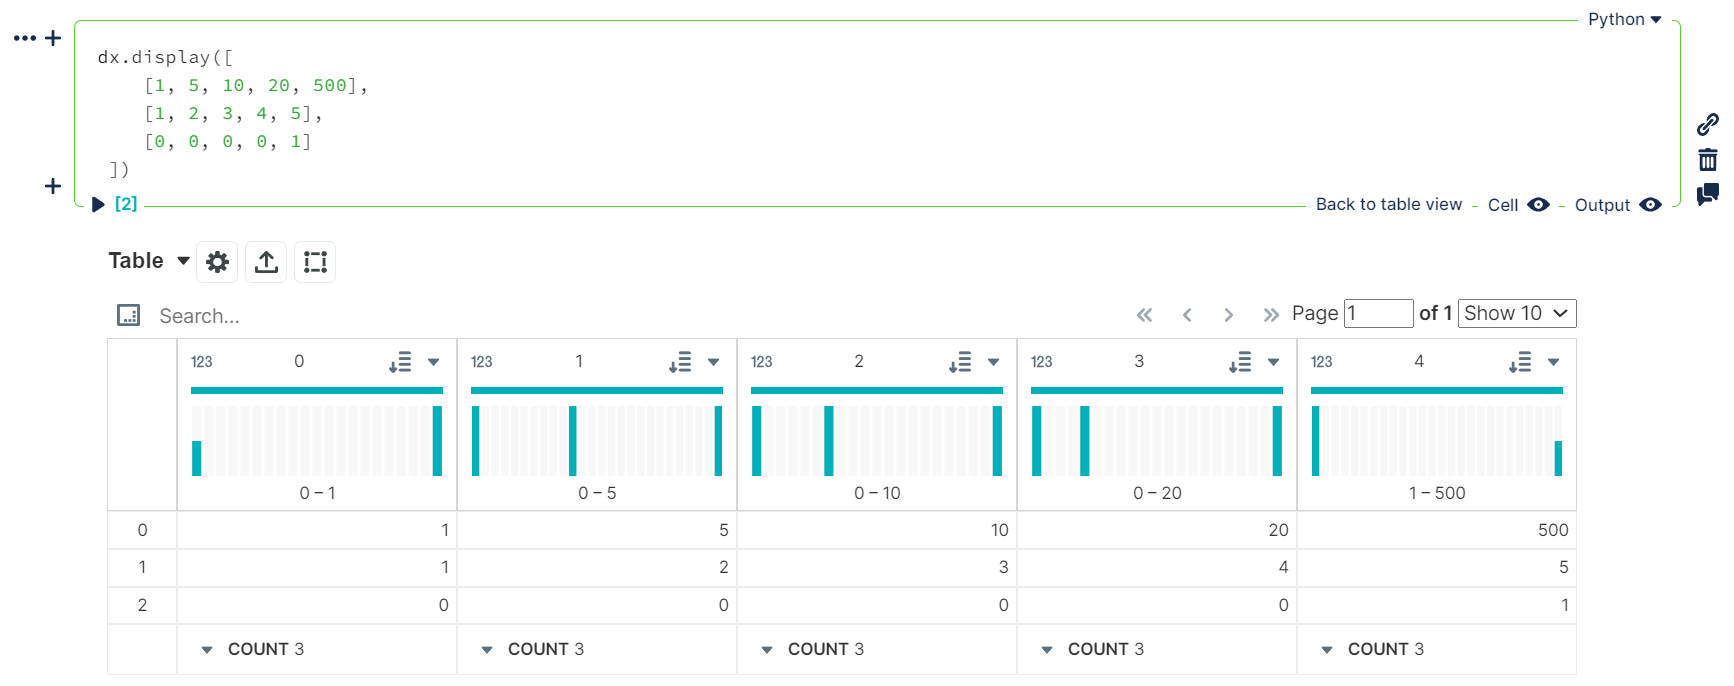
- tabular data as `dict` or `list` types
```python
dx.display([
[1, 5, 10, 20, 500],
[1, 2, 3, 4, 5],
[0, 0, 0, 0, 1]
])
```
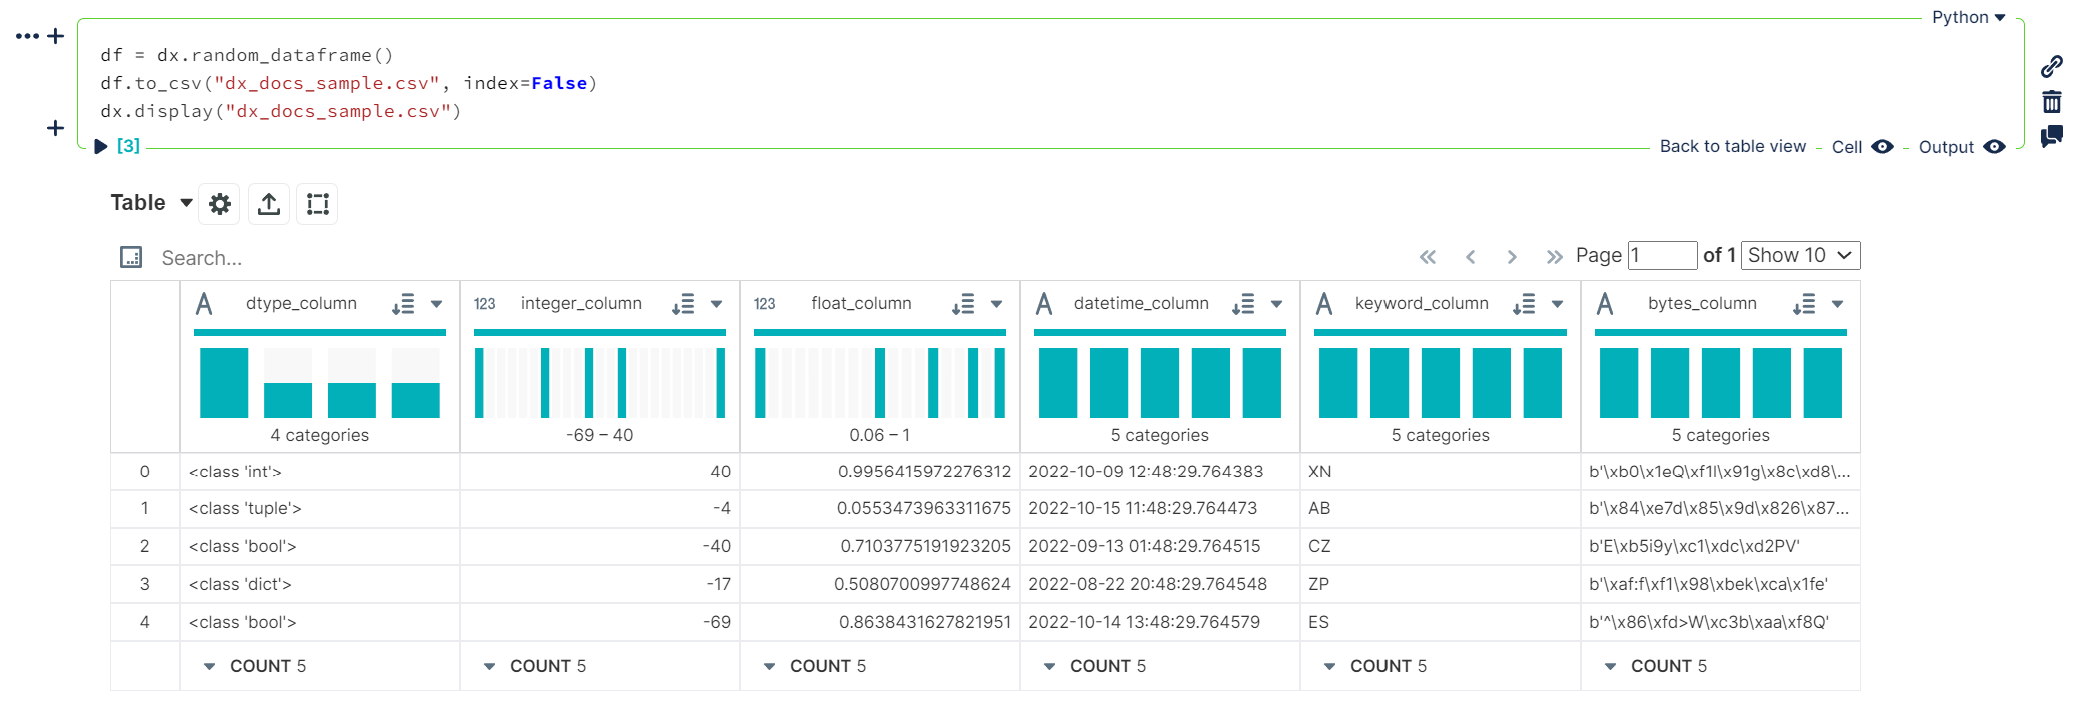
- `.csv` or `.json` filepaths
```python
df = dx.random_dataframe()
df.to_csv("dx_docs_sample.csv", index=False)
dx.display("dx_docs_sample.csv")
```
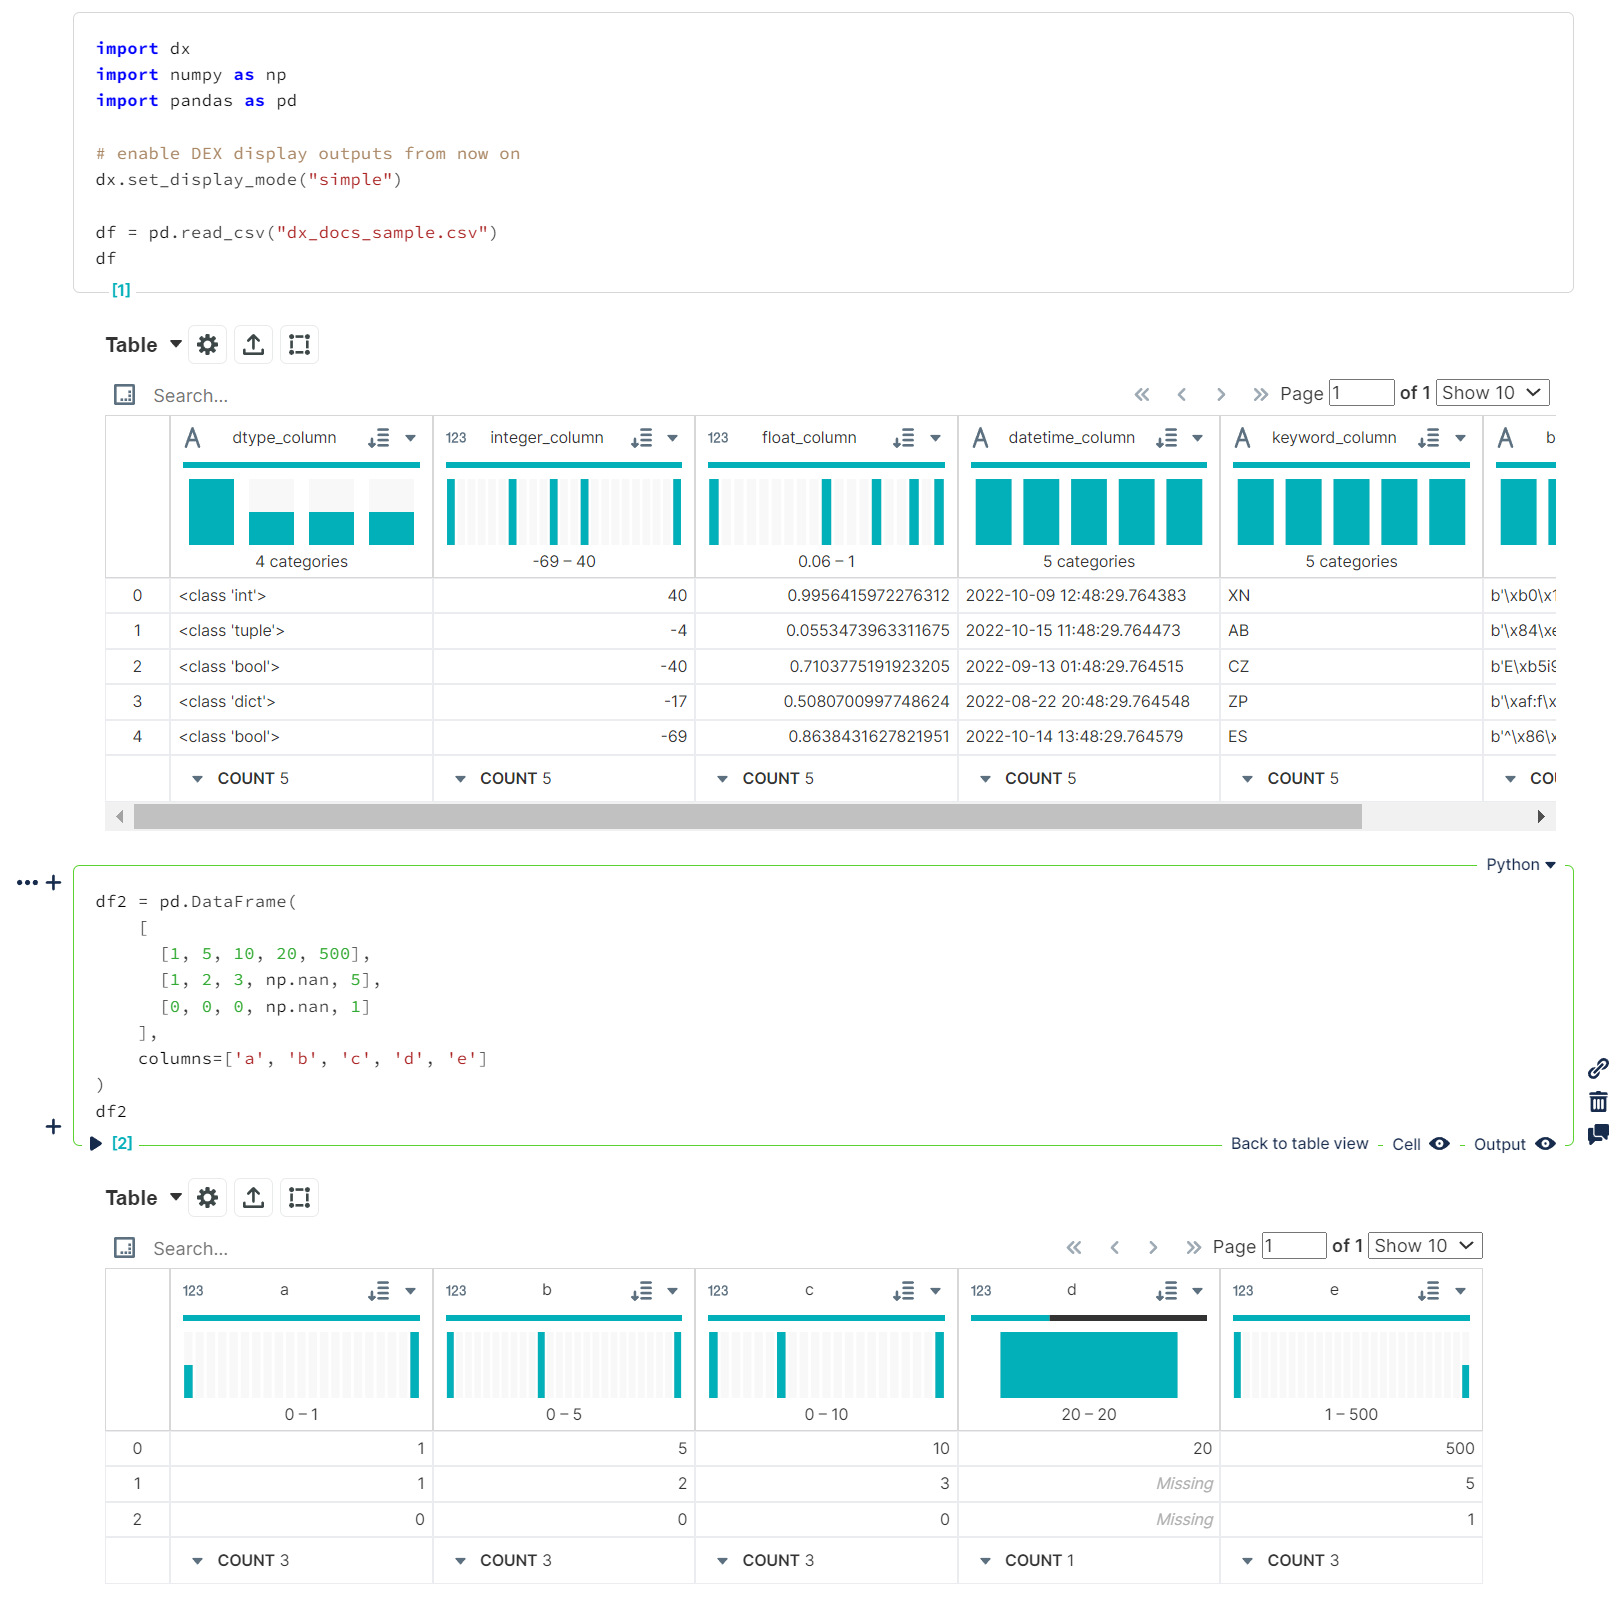
### With `dx.set_display_mode()`
Using either `"simple"` or `"enhanced"` display modes will allow `dx` will update the current `IPython` display formatters to allow DEX media type visualization of pandas `DataFrame` objects for an entire notebook / kernel session instead of the default `DataFrame` display output.
<details>
<summary>Details</summary>
This will adjust pandas options to:
- increasing the number of rows displayed to `50000` from pandas default of `60`
- increasing the number of columns displayed to `50` from pandas default of `20`
- enabling `html.table_schema` (`False` by default in pandas)
This will also handle some basic column cleaning and generate a schema for the `DataFrame` using `pandas.io.json.build_table_schema`. Depending on the display mode, the data will be transformed into either a list of dictionaries or list of lists of columnar values.
- `"simple"` - list of dictionaries
- `"enhanced"` - list of lists
</details>
> **NOTE:**
> Unlike `dx.display()`, this **only** affects pandas DataFrames (or any types set in `settings.RENDERABLE_TYPES`); it does not affect the display of `.csv`/`.json` file data, or `dict`/`list` outputs
- `dx.set_display_mode("simple")`
```python
import dx
import numpy as np
import pandas as pd
# enable DEX display outputs from now on
dx.set_display_mode("simple")
df = pd.read_csv("dx_docs_sample.csv")
df
```
```python
df2 = pd.DataFrame(
[
[1, 5, 10, 20, 500],
[1, 2, 3, np.nan, 5],
[0, 0, 0, np.nan, 1]
],
columns=['a', 'b', 'c', 'd', 'e']
)
df2
```
If, at any point, you want to go back to the default display formatting (vanilla pandas output), use the `"plain"` display mode. This will revert the IPython display format update to its original state and put the pandas options back to their default values.
- `dx.set_display_mode("plain")`
```python
# revert to original pandas display outputs from now on
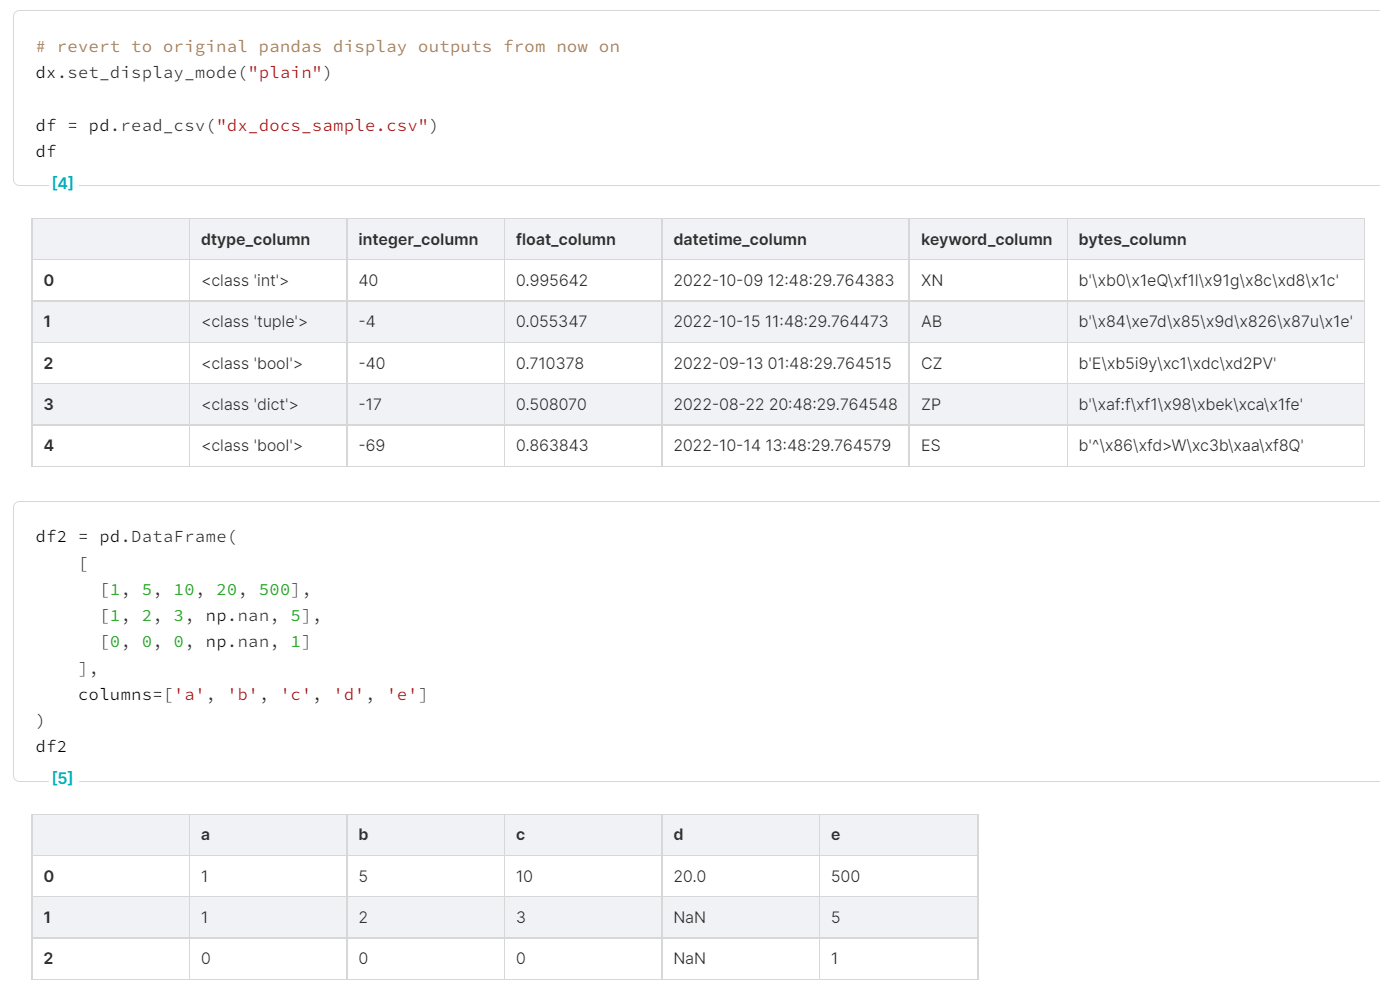
dx.set_display_mode("plain")
df = pd.read_csv("dx_docs_sample.csv")
df
```
```python
df2 = pd.DataFrame(
[
[1, 5, 10, 20, 500],
[1, 2, 3, np.nan, 5],
[0, 0, 0, np.nan, 1]
],
columns=['a', 'b', 'c', 'd', 'e']
)
df2
```
### Custom Settings
Default settings for `dx` can be found by calling `dx.settings`:
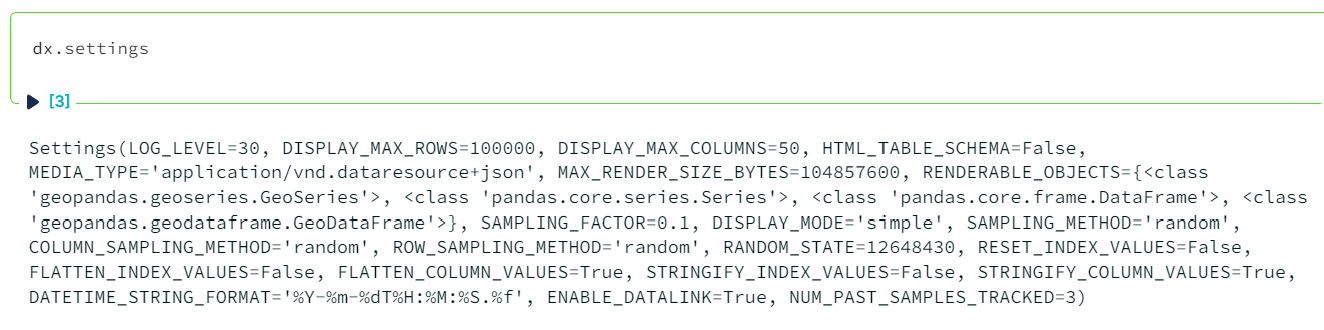
Each can be set using `dx.set_option()`:
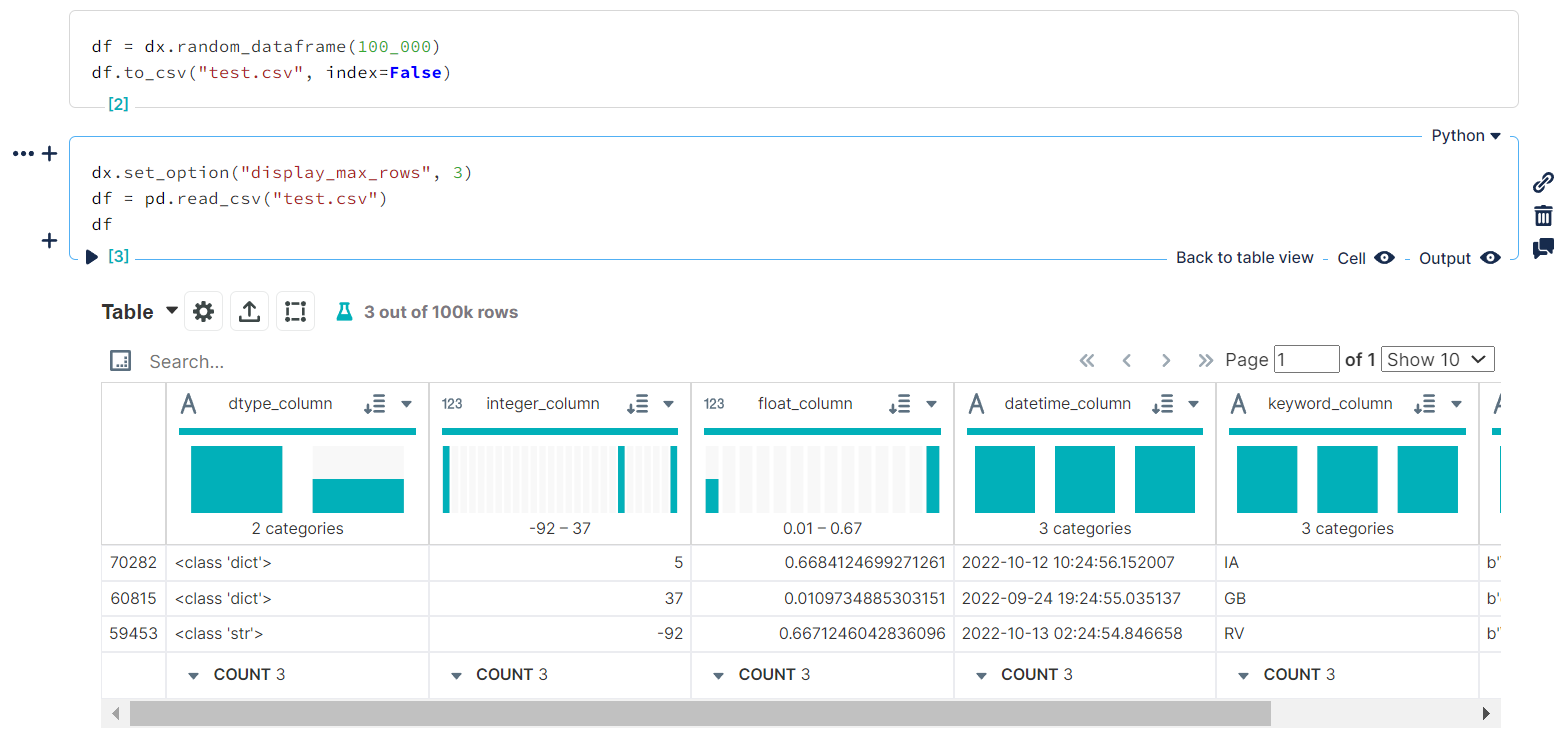
_Setting `DISPLAY_MAX_ROWS` to `3` for the current session_
...or with the `dx.settings_context()` context manager:
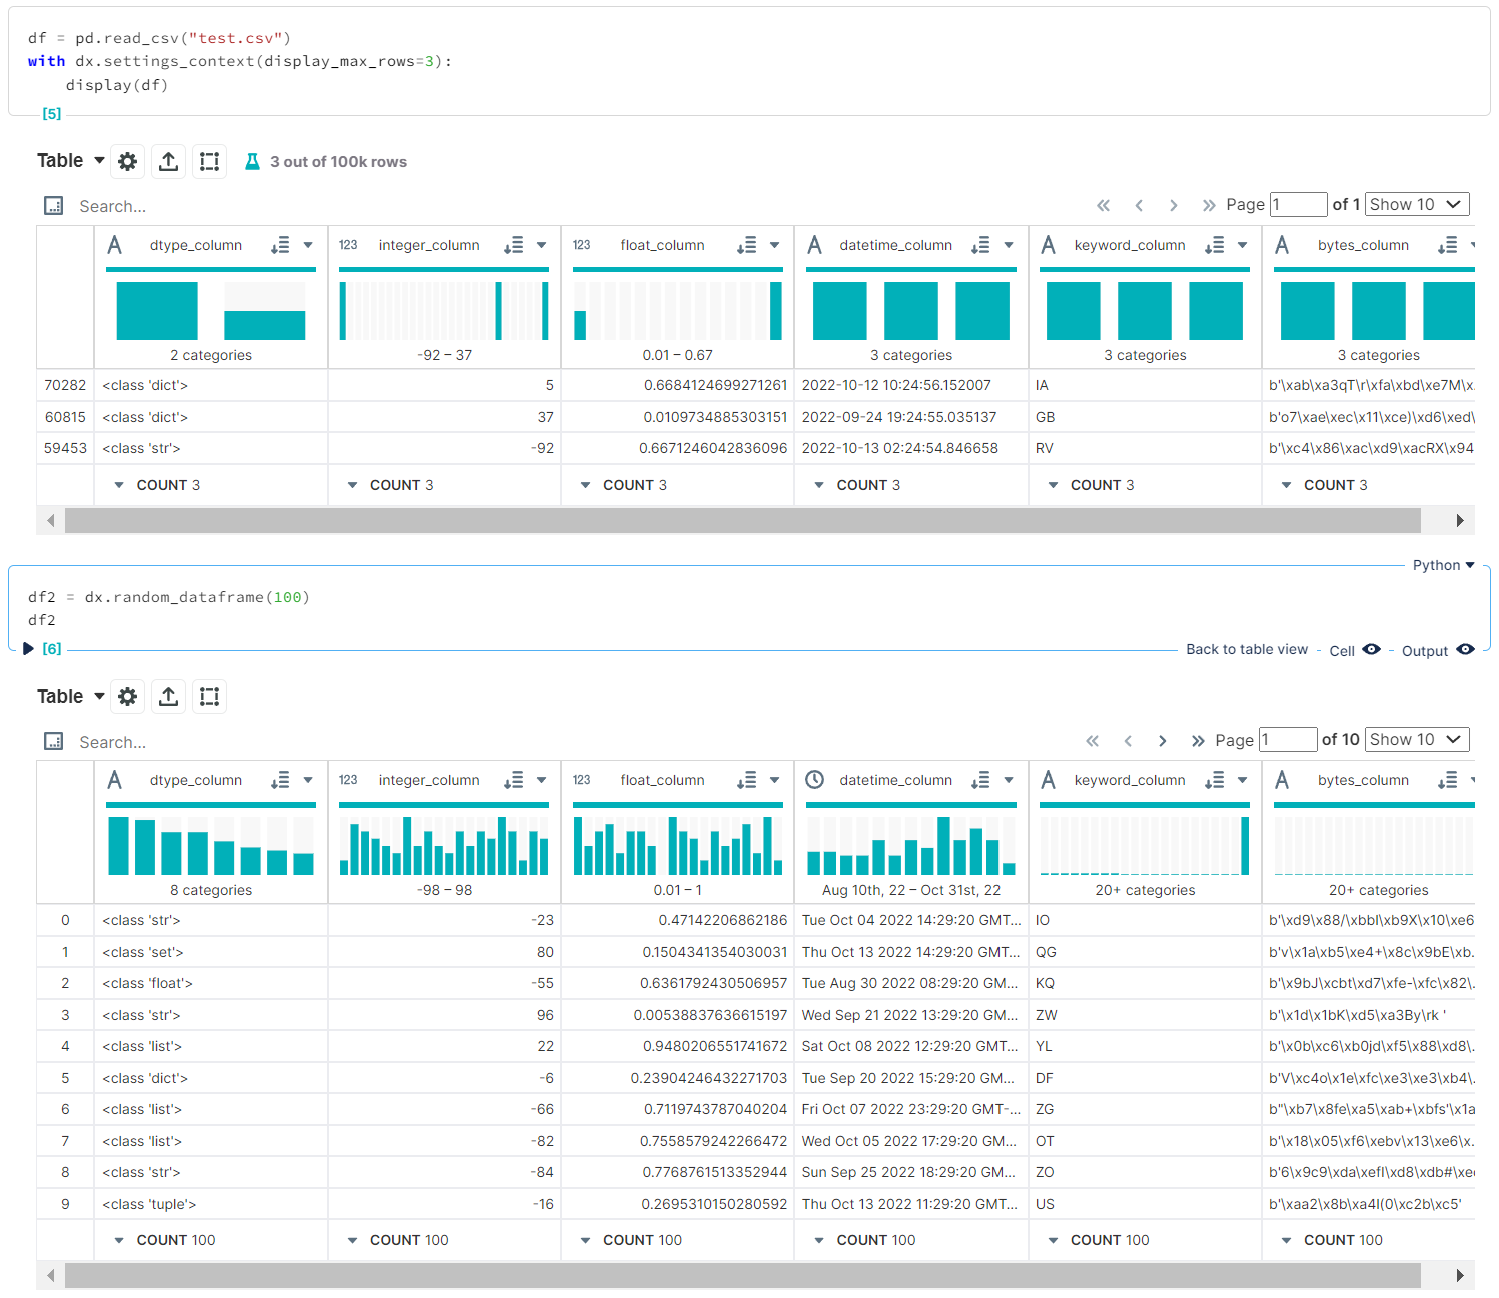
_Setting `DISPLAY_MAX_ROWS` to `3` within the current context, leaving options for the rest of the session alone_
### Generating Sample Data
Documentation coming soon!
### Usage Outside of Noteable
If using this package in a notebook environment outside of [Noteable](https://app.noteable.io/), the frontend should support the following media types:
- `application/vnd.dataresource+json` for `"simple"` display mode
- `application/vnd.dex.v1+json` for `"enhanced"` display mode
## Contributing
See [CONTRIBUTING.md](https://github.com/noteable-io/dx/blob/main/CONTRIBUTING.md).
## Code of Conduct
We follow the noteable.io [code of conduct](https://github.com/noteable-io/dx/blob/main/CODE_OF_CONDUCT.md).
## LICENSE
See [LICENSE.md](https://github.com/noteable-io/dx/blob/main/LICENSE.md).
-------
<p align="center">Open sourced with ❤️ by <a href="https://noteable.io">Noteable</a> for the community.</p>
<img href="https://pages.noteable.io/private-beta-access" src="https://assets.noteable.io/github/2022-07-29/noteable.png" alt="Boost Data Collaboration with Notebooks">


