<p align="center">
<a href="https://github.com/nschloe/dmsh"><img alt="dmsh" src="https://raw.githubusercontent.com/meshpro/dmsh/main/logo/logo-with-text.svg" width="50%"></a>
<p align="center">The worst mesh generator you'll ever use.</p>
</p>
[](https://pypi.org/project/dmsh/)
[](https://pypi.org/project/dmsh/)
[](https://github.com/nschloe/dmsh)
[](https://pypistats.org/packages/dmsh)
[](https://discord.gg/PBCCvwHqpv)
Inspired by [distmesh](http://persson.berkeley.edu/distmesh/), dmsh can be slow,
requires a lot of memory, and isn't terribly robust either.
On the plus side,
- it's got a user-friendly interface,
- is pure Python (and hence easily installable on any system), and
- it produces pretty high-quality meshes.
Combined with [optimesh](https://github.com/nschloe/optimesh), dmsh produces the
highest-quality 2D meshes in the west.
### Examples
#### Primitives
| <img alt="circle" src="https://raw.githubusercontent.com/meshpro/dmsh/main/plots/circle.svg" width="100%"> | <img alt="circle" src="https://raw.githubusercontent.com/meshpro/dmsh/main/plots/rectangle.svg" width="100%"> | <img alt="circle" src="https://raw.githubusercontent.com/meshpro/dmsh/main/plots/polygon.svg" width="100%"> |
| :--------------------------------------------------------------------------------------------------------: | :-----------------------------------------------------------------------------------------------------------: | :---------------------------------------------------------------------------------------------------------: |
```python
import dmsh
import meshio
import optimesh
geo = dmsh.Circle([0.0, 0.0], 1.0)
X, cells = dmsh.generate(geo, 0.1)
# optionally optimize the mesh
X, cells = optimesh.optimize_points_cells(X, cells, "CVT (full)", 1.0e-10, 100)
# visualize the mesh
dmsh.show(X, cells, geo)
# and write it to a file
meshio.Mesh(X, {"triangle": cells}).write("circle.vtk")
```
```python
import dmsh
geo = dmsh.Rectangle(-1.0, +2.0, -1.0, +1.0)
X, cells = dmsh.generate(geo, 0.1)
```
```python
import dmsh
geo = dmsh.Polygon(
[
[0.0, 0.0],
[1.1, 0.0],
[1.2, 0.5],
[0.7, 0.6],
[2.0, 1.0],
[1.0, 2.0],
[0.5, 1.5],
]
)
X, cells = dmsh.generate(geo, 0.1)
```
#### Combinations
##### Difference
| <img src="https://raw.githubusercontent.com/meshpro/dmsh/main/plots/moon.svg" width="100%"> | <img src="https://raw.githubusercontent.com/meshpro/dmsh/main/plots/pacman.svg" width="100%"> | <img src="https://raw.githubusercontent.com/meshpro/dmsh/main/plots/rectangle-hole-refinement.svg" width="100%"> |
| :-----------------------------------------------------------------------------------------: | :-------------------------------------------------------------------------------------------: | :--------------------------------------------------------------------------------------------------------------: |
```python
import dmsh
geo = dmsh.Circle([-0.5, 0.0], 1.0) - dmsh.Circle([+0.5, 0.0], 1.0)
X, cells = dmsh.generate(geo, 0.1)
```
```python
import dmsh
geo = dmsh.Circle([0.0, 0.0], 1.0) - dmsh.Polygon([[0.0, 0.0], [1.5, 0.4], [1.5, -0.4]])
X, cells = dmsh.generate(geo, 0.1, tol=1.0e-10)
```
The following example uses a nonconstant edge length; it depends on the distance to the
circle `c`.
```python
import dmsh
import numpy as np
r = dmsh.Rectangle(-1.0, +1.0, -1.0, +1.0)
c = dmsh.Circle([0.0, 0.0], 0.3)
geo = r - c
X, cells = dmsh.generate(geo, lambda pts: np.abs(c.dist(pts)) / 5 + 0.05, tol=1.0e-10)
```
##### Union
| <img src="https://raw.githubusercontent.com/meshpro/dmsh/main/plots/union-circles.svg" width="100%"> | <img src="https://raw.githubusercontent.com/meshpro/dmsh/main/plots/union-rectangles.svg" width="100%"> | <img src="https://raw.githubusercontent.com/meshpro/dmsh/main/plots/union-three-circles.svg" width="100%"> |
| :--------------------------------------------------------------------------------------------------: | :-----------------------------------------------------------------------------------------------------: | :--------------------------------------------------------------------------------------------------------: |
```python
import dmsh
geo = dmsh.Circle([-0.5, 0.0], 1.0) + dmsh.Circle([+0.5, 0.0], 1.0)
X, cells = dmsh.generate(geo, 0.15)
```
```python
import dmsh
geo = dmsh.Rectangle(-1.0, +0.5, -1.0, +0.5) + dmsh.Rectangle(-0.5, +1.0, -0.5, +1.0)
X, cells = dmsh.generate(geo, 0.15)
```
```python
import dmsh
import numpy as np
angles = np.pi * np.array([3.0 / 6.0, 7.0 / 6.0, 11.0 / 6.0])
geo = dmsh.Union(
[
dmsh.Circle([np.cos(angles[0]), np.sin(angles[0])], 1.0),
dmsh.Circle([np.cos(angles[1]), np.sin(angles[1])], 1.0),
dmsh.Circle([np.cos(angles[2]), np.sin(angles[2])], 1.0),
]
)
X, cells = dmsh.generate(geo, 0.15)
```
#### Intersection
| <img src="https://raw.githubusercontent.com/meshpro/dmsh/main/plots/intersection-circles.svg" width="100%"> | <img src="https://raw.githubusercontent.com/meshpro/dmsh/main/plots/intersection-three-circles.svg" width="100%"> | <img src="https://raw.githubusercontent.com/meshpro/dmsh/main/plots/intersection-circle-halfspace.svg" width="100%"> |
| :---------------------------------------------------------------------------------------------------------: | :---------------------------------------------------------------------------------------------------------------: | :------------------------------------------------------------------------------------------------------------------: |
```python
import dmsh
geo = dmsh.Circle([0.0, -0.5], 1.0) & dmsh.Circle([0.0, +0.5], 1.0)
X, cells = dmsh.generate(geo, 0.1, tol=1.0e-10)
```
```python
import dmsh
import numpy as np
angles = np.pi * np.array([3.0 / 6.0, 7.0 / 6.0, 11.0 / 6.0])
geo = dmsh.Intersection(
[
dmsh.Circle([np.cos(angles[0]), np.sin(angles[0])], 1.5),
dmsh.Circle([np.cos(angles[1]), np.sin(angles[1])], 1.5),
dmsh.Circle([np.cos(angles[2]), np.sin(angles[2])], 1.5),
]
)
X, cells = dmsh.generate(geo, 0.1, tol=1.0e-10)
```
The following uses the `HalfSpace` primtive for cutting off a circle.
```python
import dmsh
geo = dmsh.HalfSpace([1.0, 1.0]) & dmsh.Circle([0.0, 0.0], 1.0)
X, cells = dmsh.generate(geo, 0.1)
```
### Rotation, translation, scaling
| <img src="https://raw.githubusercontent.com/meshpro/dmsh/main/plots/rotation.svg" width="100%"> | <img src="https://raw.githubusercontent.com/meshpro/dmsh/main/plots/scaling.svg" width="100%"> |
| :---------------------------------------------------------------------------------------------: | :--------------------------------------------------------------------------------------------: |
```python
import dmsh
import numpy as np
geo = dmsh.Rotation(dmsh.Rectangle(-1.0, +2.0, -1.0, +1.0), 0.1 * np.pi)
X, cells = dmsh.generate(geo, 0.1, tol=1.0e-10)
```
```python
import dmsh
geo = dmsh.Rectangle(-1.0, +2.0, -1.0, +1.0) + [1.0, 1.0]
X, cells = dmsh.generate(geo, 0.1)
```
```python
import dmsh
geo = dmsh.Rectangle(-1.0, +2.0, -1.0, +1.0) * 2.0
X, cells = dmsh.generate(geo, 0.1, tol=1.0e-5)
```
### Local refinement
<img alt="local-refinement" src="https://raw.githubusercontent.com/meshpro/dmsh/main/plots/local-refinement.svg" width="30%">
All objects can be used to refine the mesh according to the distance to the object;
e.g. a `Path`:
```python
import dmsh
geo = dmsh.Rectangle(0.0, 1.0, 0.0, 1.0)
p1 = dmsh.Path([[0.4, 0.6], [0.6, 0.4]])
def target_edge_length(x):
return 0.03 + 0.1 * p1.dist(x)
X, cells = dmsh.generate(geo, target_edge_length, tol=1.0e-10)
```
### Custom shapes
It is also possible to define your own geometry. Simply create a class derived from
`dmsh.Geometry` that contains a `dist` method and a method to project points onto the
boundary.
```python
import dmsh
import numpy as np
class MyDisk(dmsh.Geometry):
def __init__(self):
self.r = 1.0
self.x0 = [0.0, 0.0]
bounding_box = [-1.0, 1.0, -1.0, 1.0]
feature_points = np.array([[], []]).T
super().__init__(bounding_box, feature_points)
def dist(self, x):
assert x.shape[0] == 2
y = (x.T - self.x0).T
return np.sqrt(np.einsum("i...,i...->...", y, y)) - self.r
def boundary_step(self, x):
# project onto the circle
y = (x.T - self.x0).T
r = np.sqrt(np.einsum("ij,ij->j", y, y))
return ((y / r * self.r).T + self.x0).T
geo = MyDisk()
X, cells = dmsh.generate(geo, 0.1)
```
### Debugging
| 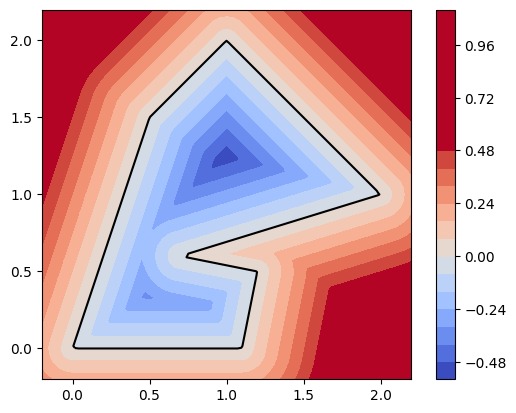 | 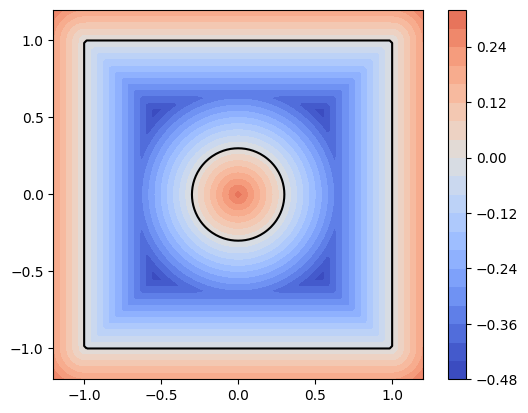 |
| :-----------------------------------------------------------------------------------------------: | :------------------------------------------------------------------------------------------------------: |
dmsh is rather fragile, but sometimes the break-downs are due to an incorrectly defined
geometry. Use
```
geo.show()
```
to inspect the level set function of your domain. (It must be negative inside the
domain and positive outside. The 0-level set forms the domain boundary.)
### Installation
dmsh is [available from the Python Package
Index](https://pypi.org/project/dmsh/), so simply type
```
pip install dmsh
```
to install.
### Testing
To run the dmsh unit tests, check out this repository and type
```
tox
```


