# datasette-dashboards
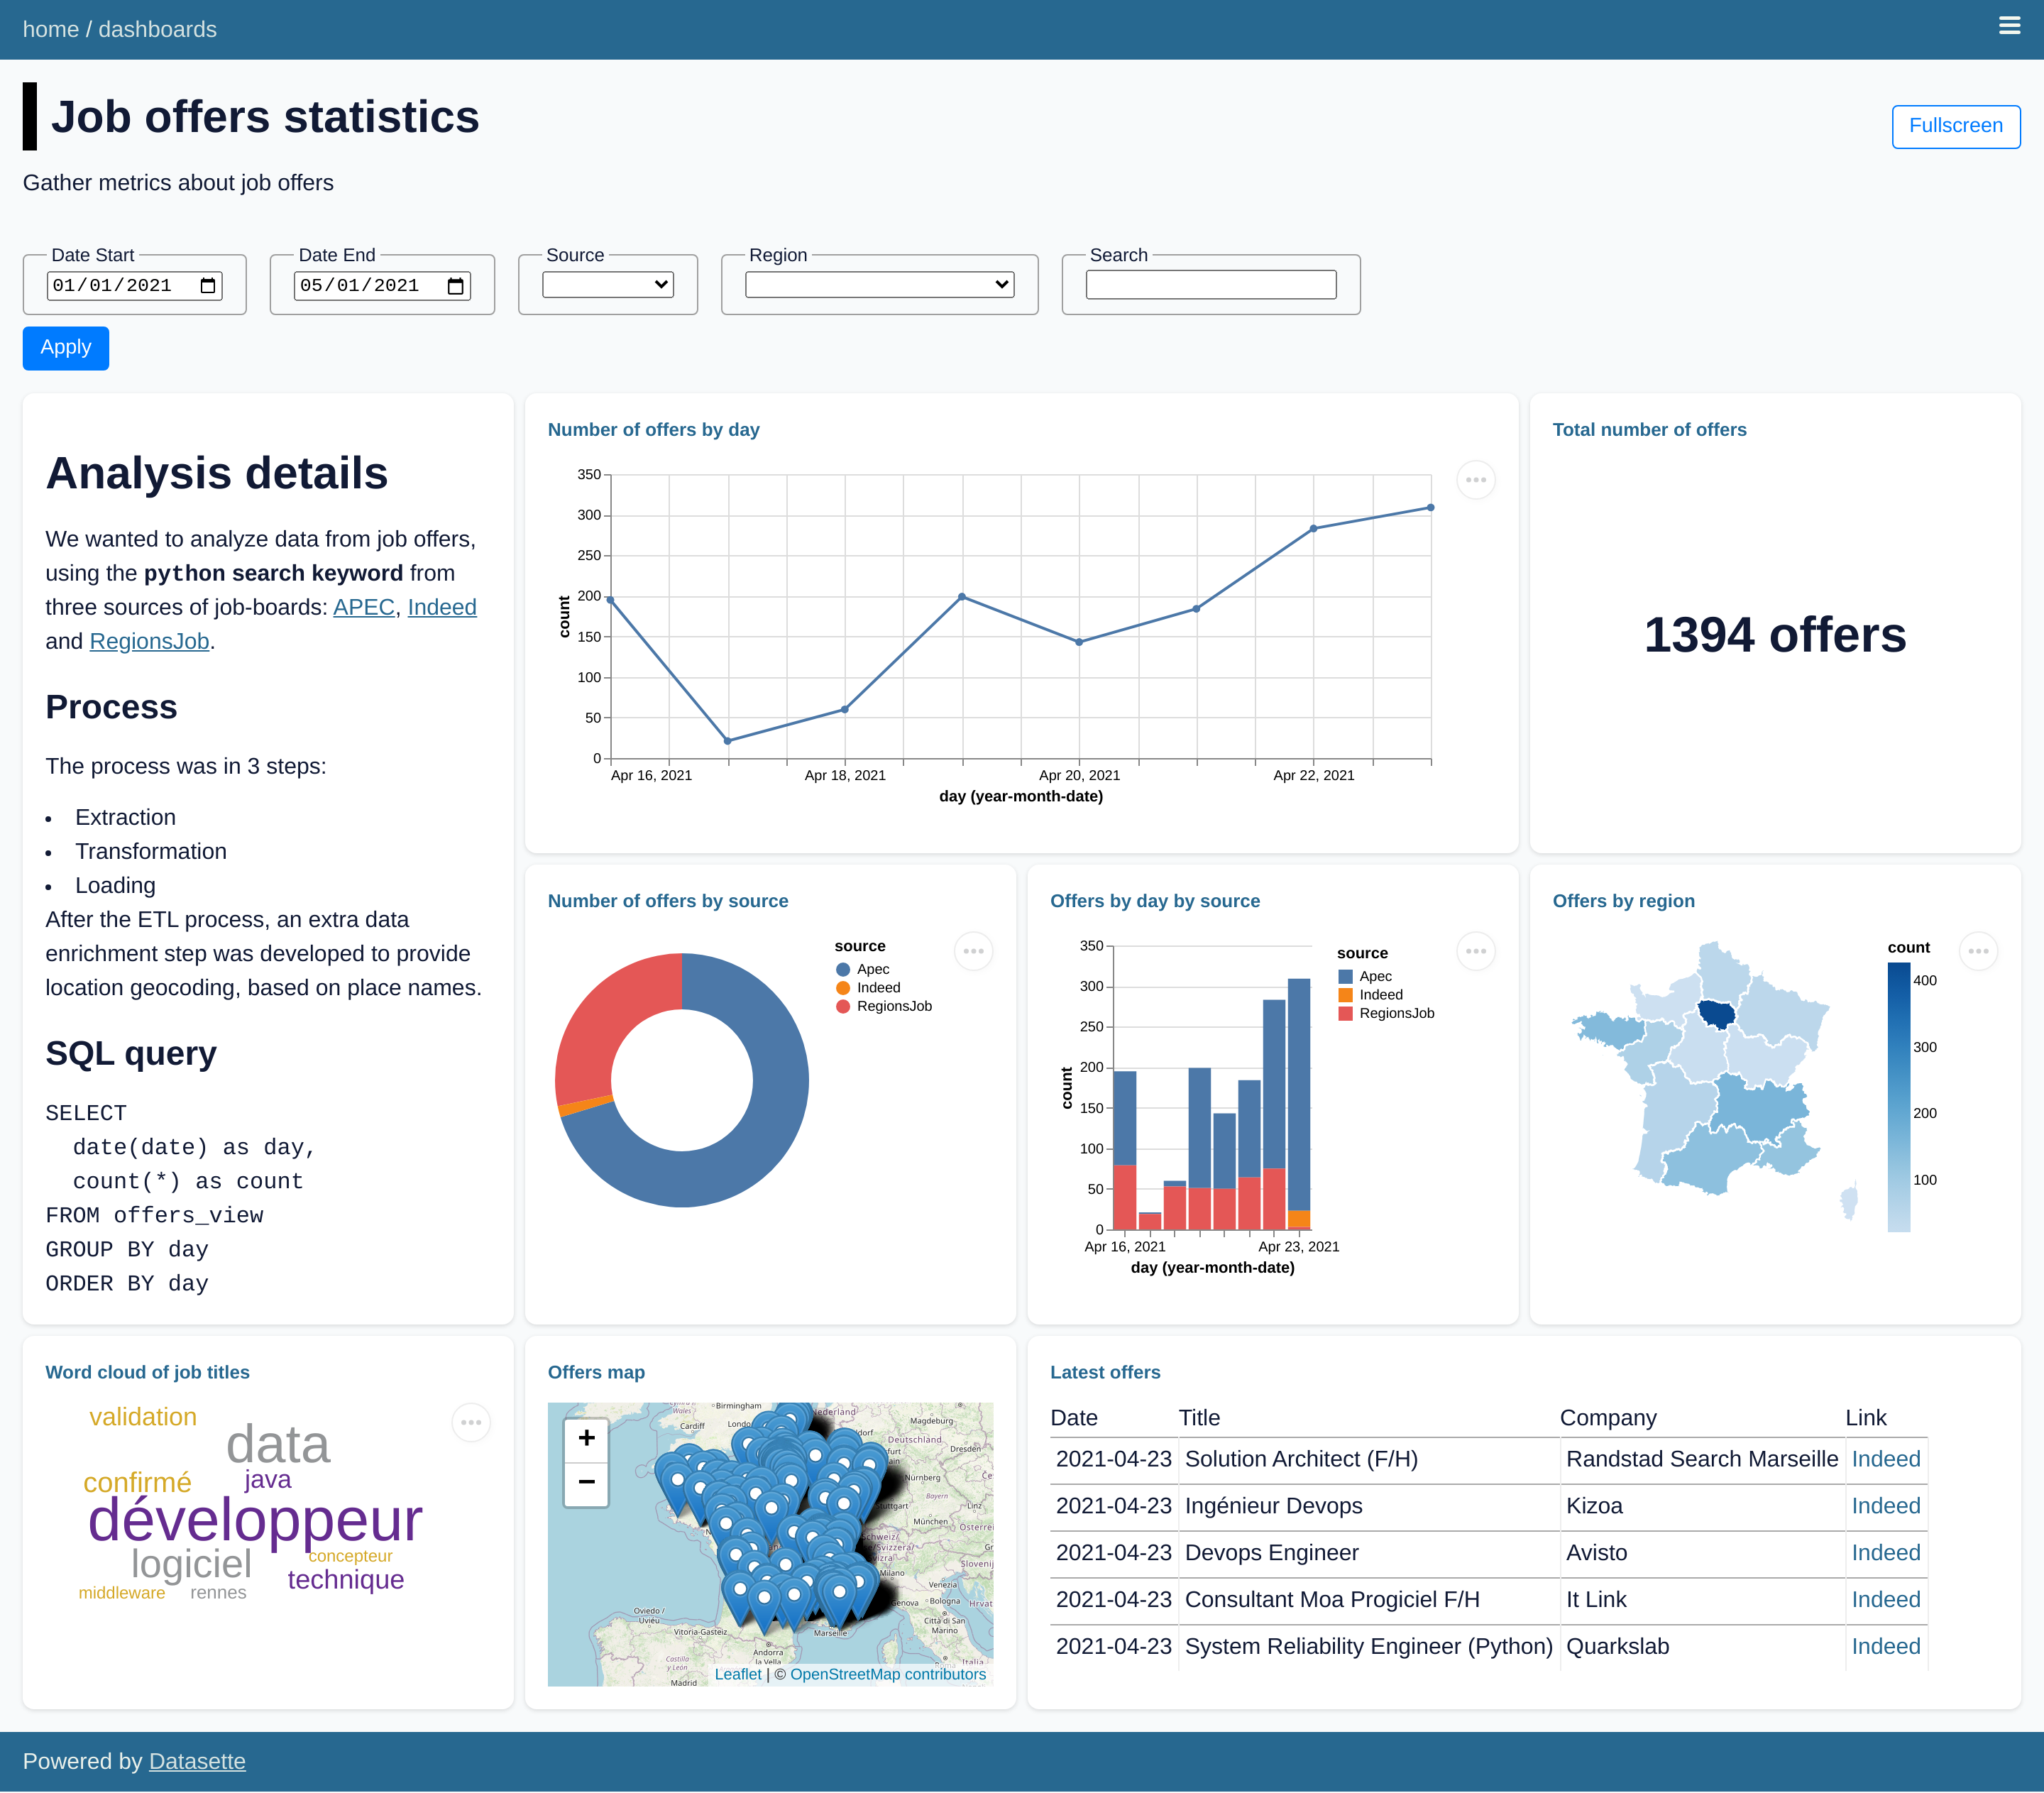
> Datasette plugin providing data dashboards from metadata
[](https://pypi.org/project/datasette-dashboards/)
[](https://github.com/rclement/datasette-dashboards/actions/workflows/ci-cd.yml)
[](https://codecov.io/gh/rclement/datasette-dashboards)
[](https://github.com/rclement/datasette-dashboards/blob/master/LICENSE)
Try out a live demo at [https://datasette-dashboards-demo.vercel.app](https://datasette-dashboards-demo.vercel.app/-/dashboards)
**WARNING**: this plugin is still experimental and not ready for production.
Some breaking changes might happen between releases before reaching a stable version.
Use it at your own risks!
## Installation
Install this plugin in the same environment as Datasette:
```bash
$ datasette install datasette-dashboards
```
## Usage
Define dashboards within `metadata.yml` / `metadata.json`:
```yaml
plugins:
datasette-dashboards:
my-dashboard:
title: My Dashboard
description: Showing some nice metrics
layout:
- [analysis-note, events-count]
- [analysis-note, events-source]
filters:
date_start:
name: Date Start
type: date
default: "2021-01-01"
date_end:
name: Date End
type: date
category:
name: My Category
type: select
options: [Option 1, Option 2, Option 3]
dynamic_category:
name: My Dynamic Category
type: select
db: jobs
query: SELECT region FROM jobs ORDER BY region ASC
charts:
analysis-note:
library: markdown
display: |-
# Analysis notes
> A quick rundown of events statistics and KPIs
events-count:
title: Total number of events
db: jobs
query: SELECT count(*) as count FROM events
library: metric
display:
field: count
prefix:
suffix:
events-source:
title: Number of events by source
db: jobs
query: SELECT source, count(*) as count FROM events WHERE TRUE [[ AND date >= date(:date_start) ]] [[ AND date <= date(:date_end) ]] GROUP BY source ORDER BY count DESC
library: vega-lite
display:
mark: { type: arc, tooltip: true }
encoding:
color: { field: source, type: nominal }
theta: { field: count, type: quantitative }
```
A new menu entry is now available, pointing at `/-/dashboards` to access all defined dashboards.
### Properties
Dashboard properties:
| Property | Type | Description |
| ------------- | -------- | --------------------- |
| `title` | `string` | Dashboard title |
| `description` | `string` | Dashboard description |
| `settings` | `object` | Dashboard settings |
| `layout` | `array` | Dashboard layout |
| `filters` | `object` | Dashboard filters |
Dashboard settings:
| Property | Type | Description |
| ------------------ | -------- | -------------------------------------------------------------- |
| `allow_fullscreen` | `bool` | Allow dashboard to be toggled in fullscreen (default `false`) |
| `autorefresh` | `number` | Auto-refresh timeout in minutes |
Dashboard filters:
| Property | Type | Description |
| --------- | ------------------ | ------------------------------------------------ |
| `name` | `string` | Filter display name |
| `type` | `string` | Filter type (`text`, `date`, `number`, `select`) |
| `default` | `string`, `number` | (optional) Filter default value |
| `min` | `number` | (optional) Filter minimum value |
| `max` | `number` | (optional) Filter maximum value |
| `step` | `number` | (optional) Filter stepping value |
| `options` | `list` | (optional) Select filter options list |
| `db` | `string` | (optional) Dynamic select filter database |
| `query` | `string` | (optional) Dynamic select filter query |
Common chart properties for all chart types:
| Property | Type | Description |
| --------- | -------- | ------------------------------------------------------------------------------------- |
| `title` | `string` | Chart title |
| `db` | `string` | Database name against which to run the query |
| `query` | `string` | SQL query to run and extract data from |
| `library` | `string` | One of supported libraries: `vega`, `vega-lite`, `markdown`, `metric`, `table`, `map` |
| `display` | `object` | Chart display specification (depend on the used library) |
To define SQL queries using dashboard filters:
```sql
SELECT * FROM mytable [[ WHERE col >= :my_filter ]]
```
```sql
SELECT * FROM mytable WHERE TRUE [[ AND col1 = :my_filter_1 ]] [[ AND col2 = :my_filter_2 ]]
```
#### Vega properties
Available configuration for `vega` charts:
| Property | Type | Description |
| --------- | -------- | ------------------------- |
| `library` | `string` | Must be set to `vega` |
| `display` | `object` | Vega specification object |
Notes about the `display` property:
- Requires a valid [Vega specification object](https://vega.github.io/vega/docs/)
- Some fields are pre-defined: `$schema`, `description`, `autosize`, `data`, `signals`
- All fields are passed along as-is (overriding pre-defined fields if any)
- Only `mark` and `encoding` fields are required as the bare-minimum
#### Vega-Lite properties
Available configuration for `vega-lite` charts:
| Property | Type | Description |
| --------- | -------- | -------------------------- |
| `library` | `string` | Must be set to `vega-lite` |
| `display` | `object` | Vega specification object |
Notes about the `display` property:
- Requires a valid [Vega-Lite specification object](https://vega.github.io/vega-lite/docs/)
- Some fields are pre-defined: `$schema`, `description`, `width`, `view`, `config`, `data`
- All fields are passed along as-is (overriding pre-defined fields if any)
- Only `mark` and `encoding` fields are required as the bare-minimum
#### Markdown properties
Available configuration for `markdown` chart:
| Property | Type | Description |
| --------- | -------- | ------------------------------------------------- |
| `library` | `string` | Must be set to `markdown` |
| `display` | `string` | Multi-line string containing the Markdown content |
Note :
- Some common properties do not apply and can be omitted: `title`, `db`, `query`
- Markdown rendering is done by [`datasette-render-markdown`](https://datasette.io/plugins/datasette-render-markdown)
- To configure Markdown rendering, extensions can be enabled in [metadata](https://datasette.io/plugins/datasette-render-markdown#user-content-markdown-extensions)
#### Metric properties
Available configuration for `metric` chart:
| Property | Type | Description |
| ---------------- | -------- | ----------------------------------------- |
| `library` | `string` | Must be set to `metric` |
| `display.field` | `string` | Numerical field to be displayed as metric |
| `display.prefix` | `string` | Prefix to be displayed before metric |
| `display.suffix` | `string` | Prefix to be displayed after metric |
Note:
- The `display.field` must reference a single-numerical value from the SQL query
(e.g. numerical `number` field in `SELECT count(*) as number FROM events`)
#### Table properties
There is no required configured in `display`, so you can either ignored or
leave it empty for table charts.
Some advice for a nice table chart:
- Set proper column names in the `SELECT` clause
- Limit the number of columns in the `SELECT` clause
- Limit the number of rows with the `LIMIT` clause
- Order the rows explicitely with the `ORDER BY` clause
- Use SQLite string concatenation operator (`||`) to format column data (for instance to include HTML markup!)
#### Map properties
Available configuration for `map` chart:
| Property | Type | Description |
| --------------------------- | --------- | ----------------------------------------------------------------------------------- |
| `library` | `string` | Must be set to `map` |
| `display.latitude_column` | `string` | Name of the latitude column (default: `latitude`) |
| `display.longitude_column` | `string` | Name of the latitude column (default: `longitude`) |
| `display.show_latlng_popup` | `boolean` | Whether or not to display latitude and longitude values in popup (default: `false`) |
**Warning**: do not try to load more than a thousand rows for a map at the risk of
slugginess and being unreadable. Make sensible use of the `LIMIT` clause to reduce
the number of items to display on the map.
### Dashboard layout
The default dashboard layout will present two charts per row (one per row on mobile).
To make use of custom dashboard layout using [CSS Grid Layout](https://developer.mozilla.org/en-US/docs/Web/CSS/CSS_Grid_Layout),
define the `layout` array property as a grid / matrix:
- Each entry represents a row of charts
- Each column is referring a chart by its property name
### Embedding dashboards and charts
Dashboards can be embedded within an HTML page using an `iframe` element:
```html
<iframe
src="/-/dashboards/my-dashboard/embed?start_date=2023-01-01&end_date=2023-12-31"
frameborder="0"
width="100%"
height="600"
allowtransparency
>
</iframe>
```
Same goes for charts:
```html
<iframe
src="/-/dashboards/my-dashboard/my-chart/embed?start_date=2023-01-01&end_date=2023-12-31"
frameborder="0"
width="100%"
height="600"
allowtransparency
>
</iframe>
```
## Development
To set up this plugin locally, first checkout the code.
Then create a new virtual environment and the required dependencies:
```bash
poetry install
poetry shell
```
To run the QA suite:
```bash
black --check datasette_dashboards tests
flake8 datasette_dashboards tests
mypy datasette_dashboards tests
pytest -v --cov=datasette_dashboards --cov=tests --cov-branch --cov-report=term-missing tests
```
## Demo
With the developmnent environment setup, you can run the demo locally:
```bash
datasette \
--metadata demo/metadata.yml \
--template-dir demo/templates \
demo/jobs.db
```
## License
Licensed under Apache License, Version 2.0
Copyright (c) 2021 - present Romain Clement


