# dash-ui
### Grid
`Grid` makes use of the
[CSS grid](https://css-tricks.com/getting-started-css-grid/)
to make creating dashboard-like layouts super easy in Dash.
### ControlPanel
`ControlPanel` adds a panel to the side of the grid which contains input components to change the state of the plot grid.
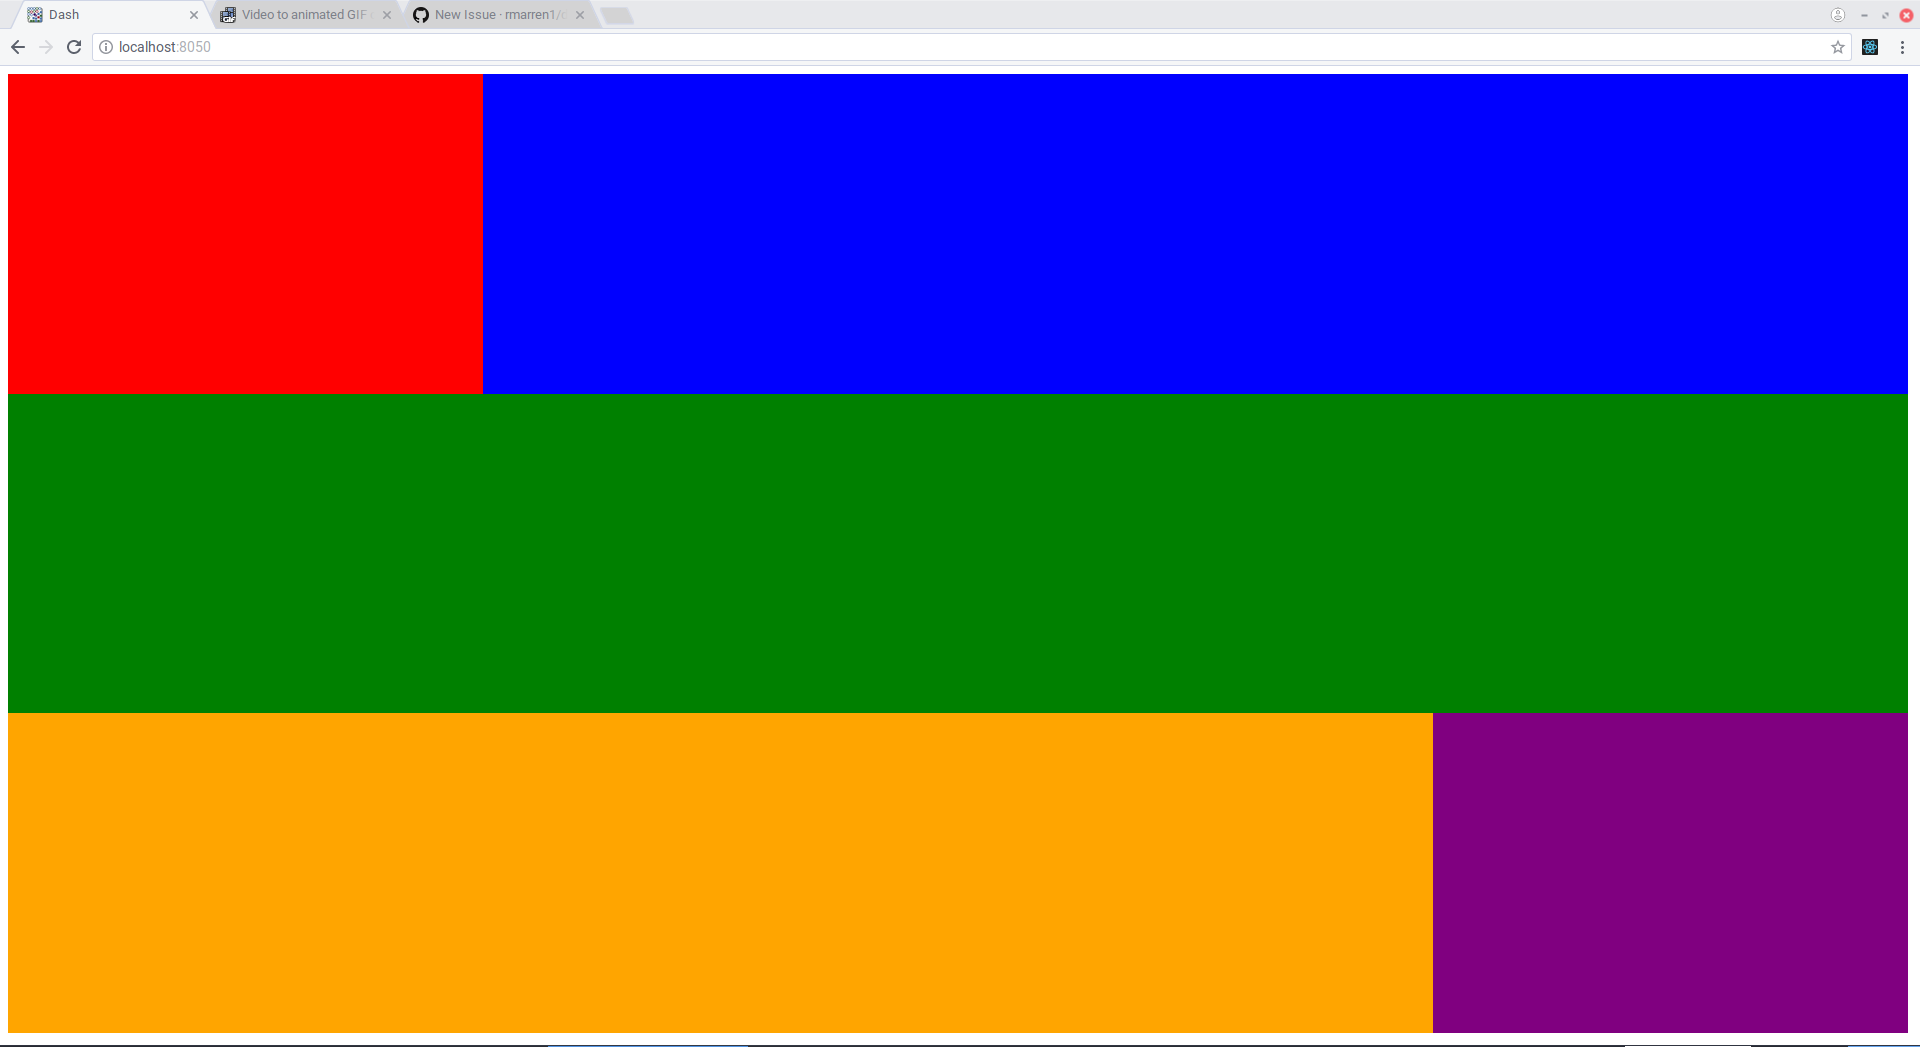
##### A Simple Example Grid
This example is found in `simple_demo.py`
First we add the external css url `https://codepen.io/rmarren1/pen/mLqGRg.css`.
This is necessary for the grid to work. If you cannot use this (e.g. you
are serving stylesheets locally) you can just serve the file at https://github.com/rmarren1/dash-ui/blob/master/dash_ui/style/css/grid.css .
Next, we create a grid with the following call:
`grid = dui.Grid(_id="grid", num_rows=12, num_cols=12, grid_padding=5)`
* `num_rows` is the number of rows in the grid, and must be between 1 and 12
* `num_cols` is the number of columns in the grid, and must be between 1 and 12
* `grid_padding` is the number of pixels to pad between grid elements, and must
be one of [0, 1, 2, 5, 10, 25, 50, 100].
Now you can add any dash element as a grid element like so:
```
grid.add_element(col=1, row=1, width=3, height=4, element=html.Div(
style={"background-color": "red", "height": "100%", "width": "100%"}
))
```
* `row` is the starting row in the grid layout
* `col` is the starting column in the grid layout
* `height` is the number of rows the element should span.
* `width` is the number of columns the element should span
Note that the rows and columns are one indexed.
Finally, we create the layout using the function
`dui.Layout(grid=grid,)`
and set `app.layout` as the object this function returns.
##### A Grid with ControlPanel
This example shows the grid with real plots (see `advanced_demo.py`)
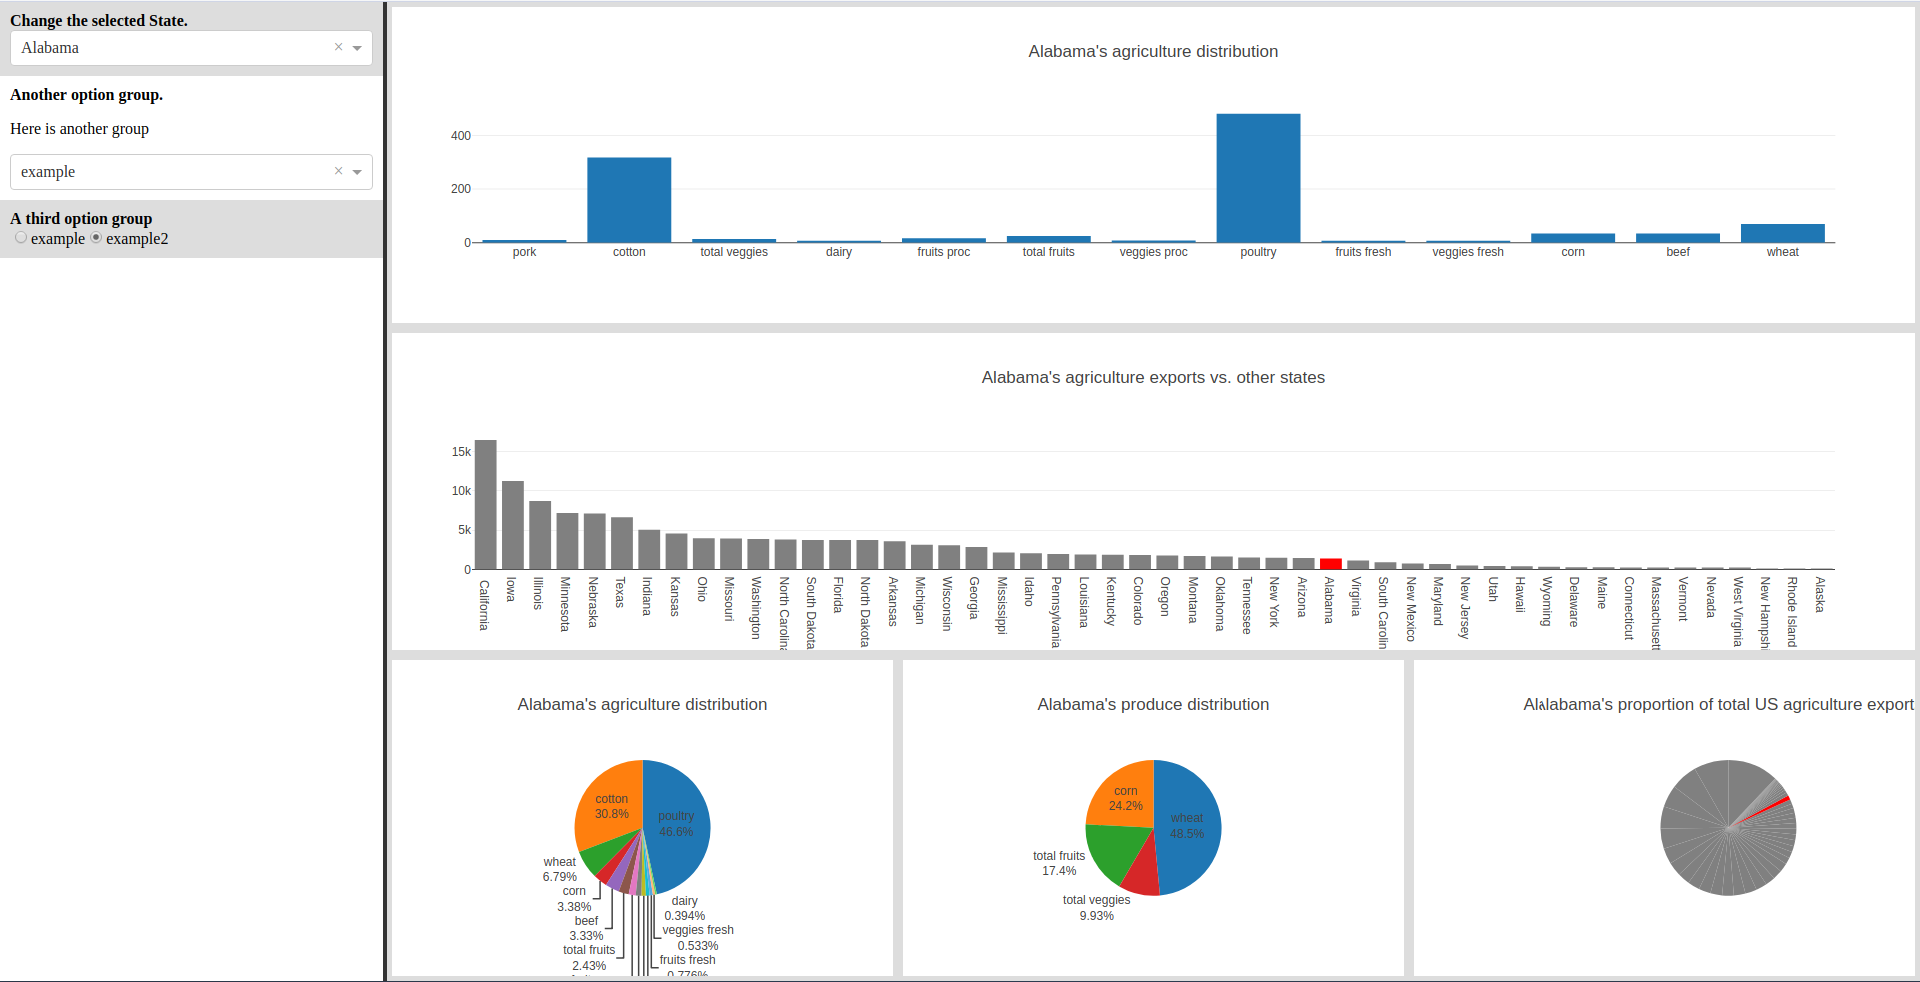
If a `ControlPanel` is not included, the grid will take up the entire screen.
To include the `ControlPanel`, create one using code like the following:
```
controlpanel = dui.ControlPanel(_id="controlpanel")
controlpanel.create_group(
group="State",
group_title="Change the selected State."
)
state_select = dcc.Dropdown(
id="state-dropdown",
options=[{
'label': x.title(),
'value': x
} for x in df["state"].tolist()
],
value=df["state"].tolist()[0]
)
controlpanel.add_element(state_select, "State")
```
then include the `controlpanel` instance as an argument to the `dui.Layout` function, e.g.
```
app.layout = dui.Layout(
grid=grid,
controlpanel=controlpanel
)
```
We can also add plotly graph elements with the shortcut
`grid.add_graph(col=1, row=1, width=3, height=4, graph_id="all-pie")`
which creates a grid element with a graph with the `id` declared in `graph_id`.
We can end up with this really nice interactive dashboard, with only
200 lines of code.
### Customizing the style
To have your own flavor of dashboard, simply fork the source SASS [here](https://codepen.io/rmarren1/pen/mLqGRg), make changes, then add the css from codepen to your project using:
```
my_css_urls = [
"https://codepen.io/your-codepen-name/pen/your-pen-identifier.css",
]
for url in my_css_urls:
app.css.append_css({
"external_url": url
})
```


