## crossmapy
crossmapy implements several causal inference algorithms based on dynamical causality (DC) framework, including Granger causality (GC),
Transfer entropy(TE), Convergent Cross Mapping(CCM), Partial Cross Mapping(PCM), Cross-Mapping Cardinality(CMC) and Cross-Mapping Entropy(CME).
### Install
```bash
pip install crossmapy
```
### Examples
#### 1. 3-variable logistic system
we use the following cascade case
<img src="https://github.com/PengTao-HUST/crossmapy/blob/master/figures/cascade.jpg" width="300px">
the corresponding dynamical equations is
<img src="https://github.com/PengTao-HUST/crossmapy/blob/master/figures/equations.png" width="500px">
where 伪<sub>x</sub> = 3.68, 伪<sub>y</sub>= 3.72 and 伪<sub>z</sub>= 3.68
##### 1.1 import packages
```python
import matplotlib.pyplot as plt
import numpy as np
import seaborn as sns
sns.set(context='notebook', style='white', font_scale=1.2)
import crossmapy as cmp # import our package
```
##### 1.2 simlate 3-variable logistic system using crossmapy
```python
c = 0.4 # coupling efficient between variables
b_xy = 0
b_yx = c
b_yz = c
b_zy = 0
b_xz = 0
b_zx = c
n_trial = 1 # number of trials
n_iter = 1000 # length of time series
noise = 0.002 # noise strength
seed = 0 # random number seed
xyz = cmp.mul_logistic_3v(b_xy=b_xy, b_yx=b_yx, b_yz=b_yz, b_zy=b_zy, b_xz=b_xz, b_zx=b_zx,
n_trail=n_trial, n_iter=n_iter, seed=seed, noise=noise)
```
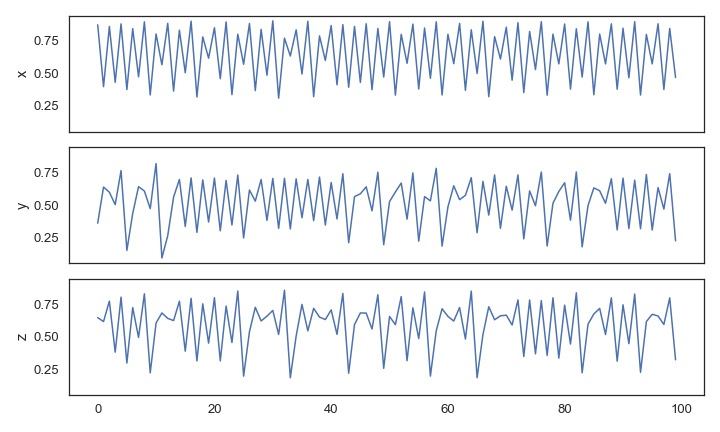
show partial simulated data
```python
fig, ax = plt.subplots(3, 1, figsize=(10, 6), sharex=True, sharey=True)
for i, l in enumerate(['x', 'y', 'z']):
ax[i].plot(xyz[0][500:600, i])
ax[i].set_ylabel(l)
plt.tight_layout()
```
##### 1.3 calculate the causal strength by six algorithms
```python
# show the ground truth of the system
truth = np.array([[0, b_yx, b_yz],
[b_xy, 0, b_zy],
[b_xz, b_yz, 0]])
truth_mat = cmp.discretize_score(truth, c/2)
truth_mat[np.diag_indices(3)] = np.nan
fig, ax = plt.subplots(figsize=(3, 3))
cmp.plot_score_matrix(truth_mat, labels=['x', 'y', 'z'], ax=ax, annot=False,
diag_line=True, cbar=False, annot_kws={'fontsize': 12})
ax.set_title('Truth')
ax.set_xlabel('Effect')
ax.set_ylabel('Cause')
plt.tight_layout()
```

```python
# API for algorithms
embed_dim = 3 # embedding dimension
GC = cmp.GrangerCausality(embed_dim=embed_dim)
TE = cmp.TransferEntropy(embed_dim=embed_dim)
CCM = cmp.ConvergeCrossMapping(embed_dim=embed_dim)
PCM = cmp.PartialCrossMapping(embed_dim=embed_dim)
CMC = cmp.CrossMappingCardinality(embed_dim=embed_dim)
DCMC = cmp.DirectCrossMappingCardinality(embed_dim=embed_dim)
models = [GC, TE, CCM, PCM, CMC, DCMC]
scores = []
for model in models:
model.fit(xyz[0]) # .fit(data) perform the calculation
scores.append(model.scores) # model.scores stores the causal strength matrix
```
compare the predict networks to the ground truth
```python
# show the predict networks, false positive (negtive) results are marked by red solid (dashed) squares.
thr = 0.5
labels = ['GC', 'TE', 'CCM', 'PCM', 'CMC', 'DCMC']
fig, ax = plt.subplots(2, 3, figsize=(8, 6))
ax = ax.flatten()
for i, label in enumerate(labels):
mat = cmp.discretize_score(scores[i], thr)
mat[np.diag_indices(3)] = np.nan
false_pos = np.where((mat==1)&(truth_mat==0))
false_neg = np.where((mat==0)&(truth_mat==1))
_ = cmp.plot_score_matrix(mat, labels=['x', 'y', 'z'], annot=False, ax=ax[i], vmin=0, vmax=1,
diag_line=True, cbar=False, annot_kws={'fontsize': 12})
ax[i].set_title(label)
_ = cmp.plot_annot_square(false_pos, lw=2, c='r', ls='-', ax=ax[i])
_ = cmp.plot_annot_square(false_neg, lw=2, c='r', ls='--', ax=ax[i])
plt.tight_layout()
```

#### 2. reproduce the results in our work
check the notebook files in [paper_examples](https://github.com/PengTao-HUST/crossmapy/tree/master/paper_examples).
### License
MIT License


