[](https://zenodo.org/badge/latestdoi/102892750)
[](https://badge.fury.io/py/clana)
[](https://pypi.org/project/clana/)
[](http://clana.readthedocs.io/en/latest/?badge=latest)
[](https://travis-ci.org/MartinThoma/clana)
[](https://coveralls.io/github/MartinThoma/clana?branch=master)
[](https://github.com/psf/black)


[](https://www.codefactor.io/repository/github/martinthoma/clana/overview/master)
# clana
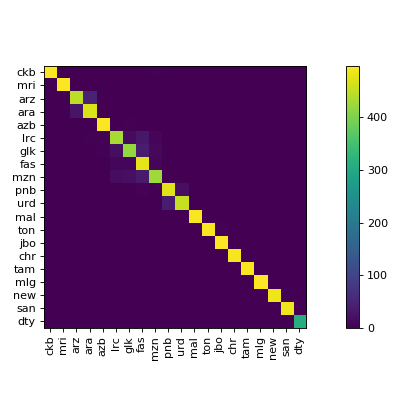
`clana` is a library and command line application to visualize confusion matrices of
classifiers with lots of classes. The two key contribution of clana are
Confusion Matrix Ordering (CMO) as explained in chapter 5 of [Analysis and Optimization of Convolutional Neural Network Architectures](https://arxiv.org/abs/1707.09725) and an optimization
algorithm to to achieve it. The CMO technique can be applied to any multi-class
classifier and helps to understand which groups of classes are most similar.
## Installation
The recommended way to install clana is:
```
$ pip install clana --user --upgrade
```
If you want the latest version:
```
$ git clone https://github.com/MartinThoma/clana.git; cd clana
$ pip install -e . --user
```
## Usage
```
$ clana --help
Usage: clana [OPTIONS] COMMAND [ARGS]...
Clana is a toolkit for classifier analysis.
See https://arxiv.org/abs/1707.09725, Chapter 4.
Options:
--version Show the version and exit.
--help Show this message and exit.
Commands:
distribution Get the distribution of classes in a dataset.
get-cm Generate a confusion matrix from predictions and ground...
get-cm-simple Generate a confusion matrix.
visualize Optimize and visualize a confusion matrix.
```
The visualize command gives you images like this:
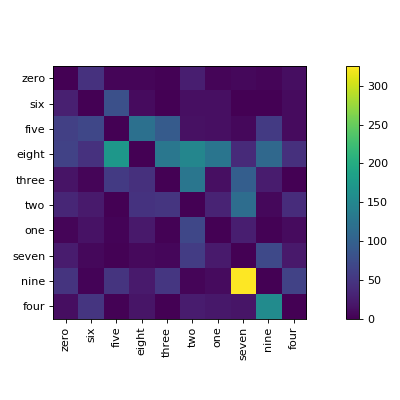
### MNIST example
```
$ cd docs/
$ python mnist_example.py # creates `train-pred.csv` and `test-pred.csv`
$ clana get-cm --gt gt-train.csv --predictions train-pred.csv --n 10
2019-09-14 09:47:30,655 - root - INFO - cm was written to 'cm.json'
$ clana visualize --cm cm.json --zero_diagonal
Score: 13475
2019-09-14 09:49:41,593 - root - INFO - n=10
2019-09-14 09:49:41,593 - root - INFO - ## Starting Score: 13475.00
2019-09-14 09:49:41,594 - root - INFO - Current: 13060.00 (best: 13060.00, hot_prob_thresh=100.0000%, step=0, swap=False)
[...]
2019-09-14 09:49:41,606 - root - INFO - Current: 9339.00 (best: 9339.00, hot_prob_thresh=100.0000%, step=238, swap=False)
Score: 9339
Perm: [0, 6, 5, 8, 3, 2, 1, 7, 9, 4]
2019-09-14 09:49:41,639 - root - INFO - Classes: [0, 6, 5, 8, 3, 2, 1, 7, 9, 4]
Accuracy: 93.99%
2019-09-14 09:49:41,725 - root - INFO - Save figure at '/home/moose/confusion_matrix.tmp.pdf'
2019-09-14 09:49:41,876 - root - INFO - Found threshold for local connection: 398
2019-09-14 09:49:41,876 - root - INFO - Found 9 clusters
2019-09-14 09:49:41,877 - root - INFO - silhouette_score=-0.012313948323292875
1: [0]
1: [6]
1: [5]
1: [8]
1: [3]
1: [2]
1: [1]
2: [7, 9]
1: [4]
```
This gives

#### Label Manipulation
Prepare a `labels.csv` which **has to have a header row**:
```
$ clana visualize --cm cm.json --zero_diagonal --labels mnist/labels.csv
```
### Data distribution
```
$ clana distribution --gt gt.csv --labels labels.csv [--out out/] [--long]
```
prints one line per label, e.g.
```
60% cat (56789 elements)
20% dog (12345 elements)
5% mouse (1337 elements)
1% tux (314 elements)
```
If `--out` is specified, it creates a horizontal bar chart. The first bar is
the most common class, the second bar is the second most common class, ...
It uses the short labels, except `--long` is added to the command.
### Visualizations
See [visualizations](docs/visualizations.md)
## Usage as a library
```
>>> import numpy as np
>>> arr = np.array([[9, 4, 7, 3, 8, 5, 2, 8, 7, 6],
[4, 9, 2, 8, 5, 8, 7, 3, 6, 7],
[7, 2, 9, 1, 6, 3, 0, 8, 5, 4],
[3, 8, 1, 9, 4, 7, 8, 2, 5, 6],
[8, 5, 6, 4, 9, 6, 3, 7, 8, 7],
[5, 8, 3, 7, 6, 9, 6, 4, 7, 8],
[2, 7, 0, 8, 3, 6, 9, 1, 4, 5],
[8, 3, 8, 2, 7, 4, 1, 9, 6, 5],
[7, 6, 5, 5, 8, 7, 4, 6, 9, 8],
[6, 7, 4, 6, 7, 8, 5, 5, 8, 9]])
>>> from clana.optimize import simulated_annealing
>>> result = simulated_annealing(arr)
>>> result.cm
array([[9, 8, 7, 6, 5, 4, 3, 2, 1, 0],
[8, 9, 8, 7, 6, 5, 4, 3, 2, 1],
[7, 8, 9, 8, 7, 6, 5, 4, 3, 2],
[6, 7, 8, 9, 8, 7, 6, 5, 4, 3],
[5, 6, 7, 8, 9, 8, 7, 6, 5, 4],
[4, 5, 6, 7, 8, 9, 8, 7, 6, 5],
[3, 4, 5, 6, 7, 8, 9, 8, 7, 6],
[2, 3, 4, 5, 6, 7, 8, 9, 8, 7],
[1, 2, 3, 4, 5, 6, 7, 8, 9, 8],
[0, 1, 2, 3, 4, 5, 6, 7, 8, 9]])
>>> result.perm
array([2, 7, 0, 4, 8, 9, 5, 1, 3, 6])
```
You can visualize the `result.cm` and use the `result.perm` to get your labels
in the same order:
```
# Just some example labels
# ['0', '1', '2', '3', '4', '5', '6', '7', '8', '9', '10']
>>> labels = [str(el) for el in range(11)]
>>> np.array(labels)[result.perm]
array(['2', '7', '0', '4', '8', '9', '5', '1', '3', '6'], dtype='<U2')
```


