# Centerline-Width


Find the centerline and width of rivers based on the latitude and longitude of the right and left bank
| River Outlined in ArcGIS | Generated Centerline for the River Bank |
| ------------- | ------------- |
| 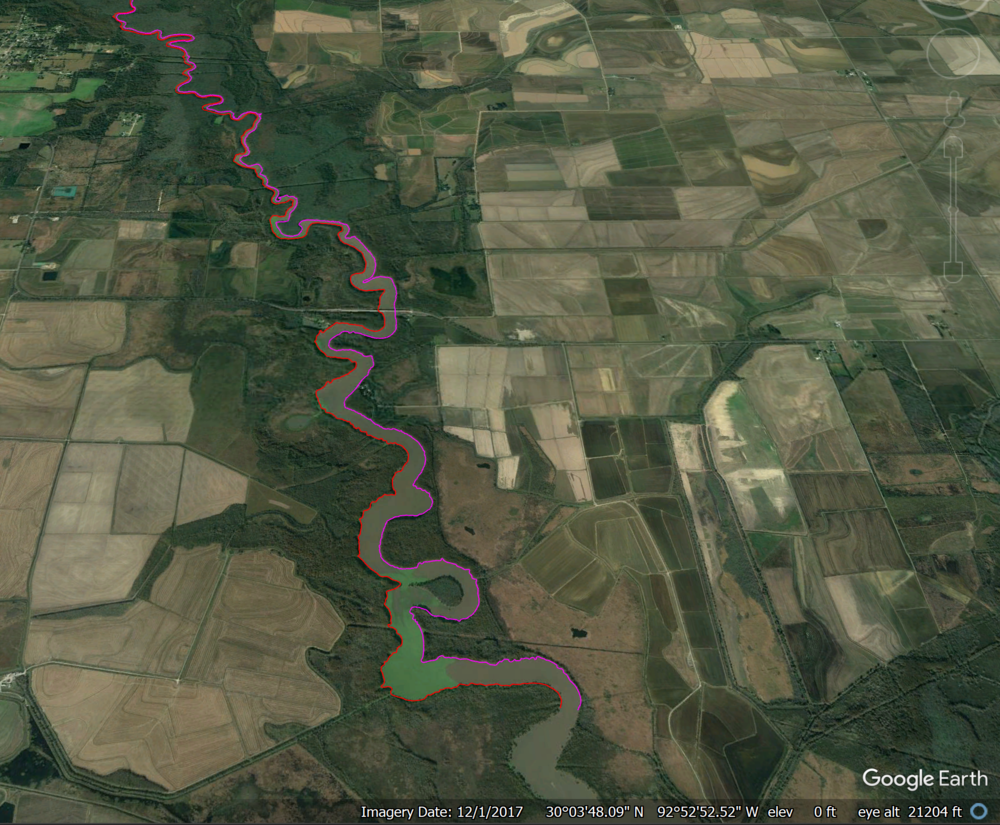 | 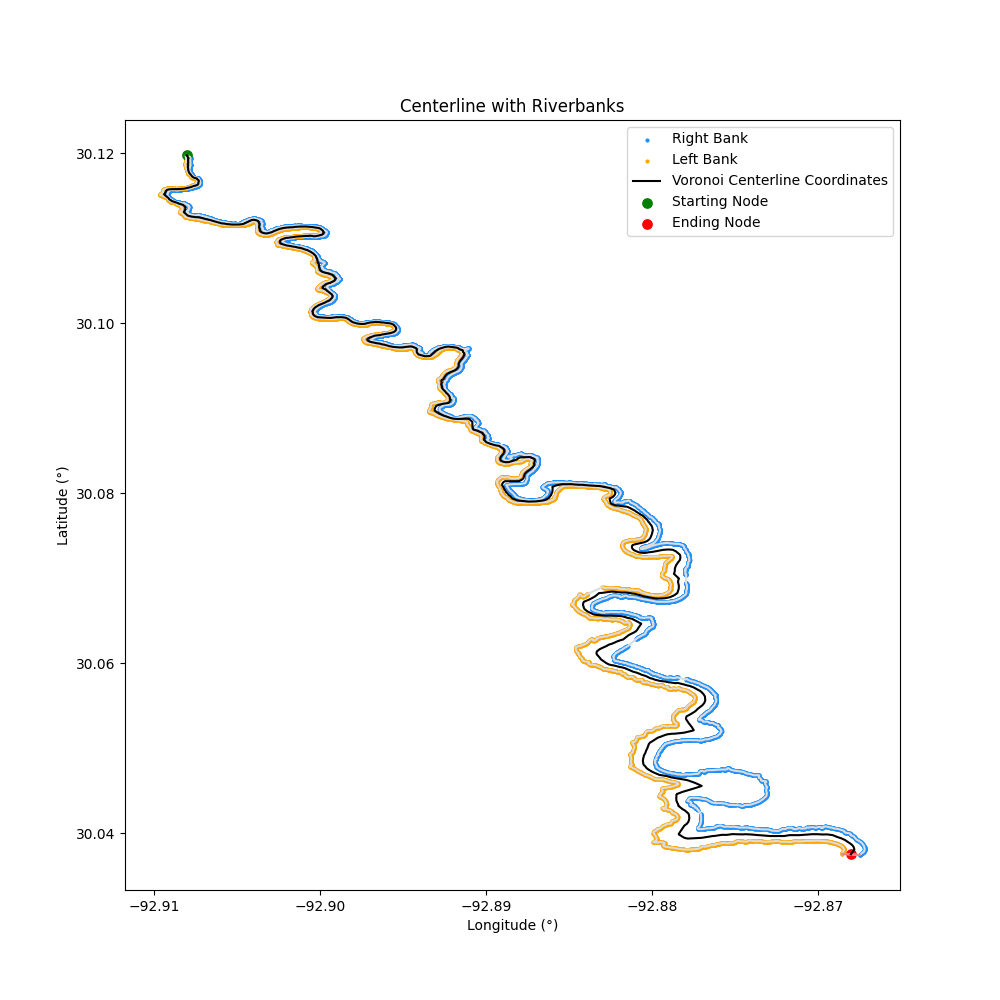 |
Python implementation of [R-Code CMGO](https://github.com/AntoniusGolly/cmgo) (with modification)
## Requirements
Currently running on Python 3.7+
```
pip install -r requirments.txt
```
## Running Script
### Converted Data Text File to CSV
Convert a text file with coordinates for a left and right bank's latitude/longitude
```
llat llon rlat rlon
30.037581 -92.868569 30.119804 -92.907933
30.037613 -92.868549 30.119772 -92.907924
30.037648 -92.868546 30.119746 -92.907917
30.037674 -92.868536 30.119721 -92.907909
30.037702 -92.868533 30.119706 -92.907905
```
Scripts expect data as a list of point for left and right banks:
- Header: llat, llon, rlat, rlon
```
convertColumnsToCSV(text_file=None, flipBankDirection=False)
```
* **[REQUIRED]** text_file (string): File location of the text file to convert
* [OPTIONAL] flipBankDirection (boolean): If the latitude/longitude of the banks are generated in reverse order, flip the final values so left/right bank are in order
```python
import centerline_width
centerline_width.convertColumnsToCSV(text_file="data/river_coords.txt", flipBankDirection=True)
```
Converts text file:
```
llat llon rlat rlon
30.037581 -92.868569 30.119804 -92.907933
30.037613 -92.868549 30.119772 -92.907924
30.037648 -92.868546 30.119746 -92.907917
30.037674 -92.868536 30.119721 -92.907909
30.037702 -92.868533 30.119706 -92.907905
```
To a CSV file:
```
llat,llon,rlat,rlon
30.037581,-92.868569,30.037441,-92.867476
30.037613,-92.868549,30.037448,-92.867474
30.037648,-92.868546,30.037482,-92.867449
30.037674,-92.868536,30.037506,-92.867432
30.037702,-92.868533,30.037525,-92.867430
```
### Plot Centerline in Matplotlib
Plot the centerline created from a list of right and left banks with Voronoi vertices
```
plotCenterline(csv_data=None,
display_all_possible_paths=False,
plot_title=None,
save_plot_name=None,
displayVoronoi=False,
optional_cutoff=None)
```
* **[REQUIRED]** csv_data (string): File location of the text file to convert
* [OPTIONAL] display_all_possible_paths (boolean): Display all possible paths, not just the centerline (useful for debugging)
* [OPTIONAL] plot_title (string): Change plot title, defaults to "River Coordinates: Valid Centerline = True/False, Valid Polygon = True/False"
* [OPTIONAL] save_plot_name (string): Save the plot with a given name and location
* [OPTIONAL] displayVoronoi (boolean): Overlay Voronoi diagram used to generate centerline
* [OPTIONAL] optional_cutoff (int): Include only the first x amount of the data to chart (useful for debugging)
```python
import centerline_width
centerline_width.plotCenterline(csv_data="data/river_coords.csv",
save_plot_name="data/river_coords.png",
display_all_possible_paths=True,
displayVoronoi=False,
optional_cutoff=cutoff)
```
Output:

### Return Latitude/Longitude Coordinates of Centerline
Return a list of lists for each latitude/longtiude coordinate of the centerline
```
centerlineLatitudeLongitude(csv_data=None, optional_cutoff=None)
```
* **[REQUIRED]** csv_data (string): File location of the text file to convert
* [OPTIONAL] optional_cutoff (int): Include only the first x amount of the data to chart (useful for debugging)
```python
import centerline_width
centerline_long_lat_coordinates = centerline_width.centerlineLatitudeLongitude(csv_data="data/river_coords.csv", optional_cutoff=cutoff)
```
Output: `[(-92.86788596499872, 30.03786596717931), (-92.86789573751797, 30.037834641974108), (-92.8679141386283, 30.037789636848878), (-92.8679251193248, 30.037756853899904), (-92.86796903819089, 30.03765423778148), (-92.86797335733262, 30.037643336049054), (-92.8679920356456, 30.037592224469797), (-92.86800576063828, 30.037555441489403), (-92.86800841510367, 30.037546512833107), (-92.8680119498663, 30.03753043193875)]`
### Return Width of River
Return the width of the river based on the centerline
```
riverWidthFromCenterline(csv_data=None,
centerline_coordinates=None,
save_to_csv=None,
optional_cutoff=None)
```
* **[REQUIRED]** csv_data (string): File location of the text file to convert
* **[REQUIRED]** centerline_coordinates (list): A list of centerline coordinates (via centerlineLatitudeLongitude())
* [OPTIONAL] plot_title (string): Change plot title, defaults to "River Coordinates: Valid Centerline = True/False, Valid Polygon = True/False"
* [OPTIONAL] save_to_csv (string): Save the csv with a given name and location
* [OPTIONAL] optional_cutoff (int): Include only the first x amount of the data to chart (useful for debugging)
```python
import centerline_width
river_width_dict = centerline_width.riverWidthFromCenterline(csv_data="data/river_coords.csv", centerline_coordinates=centerline_long_lat_coordinates,
save_to_csv="data/river_width.csv")
```
Output: ``
## Documentation and Algorithm (Backend)
The centerline is defined by the greatest distance from the right and left bank, created from a Voronoi Diagram. The remaining paths within the river are filtered through Dijkstra's algorithm to find the shortest path that is the centerline
### Right and Left bank points are plotted (X-Axis for Latitude, Y-Axis for Longitude)

### Generate a polygon to encapsulate the river between the right and left banks to define in and outside of river

### Generate a Voronoi based on the points along the river banks

### Display Voronoi ridge vertices that lie within the polygon (within the river banks)

### Filter out any point pairs that only have one connections to filter out the short dead end paths and find the starting and ending node based on distance from the top and bottom of polygon


### Find the shortest path from the starting node to the ending node ([Dijkstra's Algorithm](https://networkx.org/documentation/stable/reference/algorithms/generated/networkx.algorithms.shortest_paths.generic.shortest_path.html#networkx.algorithms.shortest_paths.generic.shortest_path))
| Points on River Bank | NetworkX Graph of Points on River Bank |
| ------------- | ------------- |
|  |  |
### Display the centerline found by connecting the starting/ending node with the shortest path

This is an attempt at a more robust algorithm working from raw data to ensure that all dead ends are removed and no gaps exist in the centerline
Points that only have one connection are removed, but by limiting the number of connections for a point to just two will create gaps. The Voronoi vertices connect to other vertex values, but some connect to more and some only connect to one other point. Removing additional values will create gaps, so this is avoided in this code by not applying additional filters.
**All vertices:**

**Vertices that have at least two connections (that would create gaps):**

## Debugging and Edge Cases
A polygon is invalid if it overlaps within itself:

In this example, the polygon is invalid, but with such a small overlap it is still able to find a valid path
With limited data, the polygon will overlap more dramatically and will no longer be able to find a valid centerline:

If the data starts with a large width, it is possible for the starting node to be invalid

Currently, the starting node is determined by the closest node to the top of the bank (in green) and the ending node is determined by the closest node to the bottom of the bank (in red)
## Citations
Based on the work:
Golly, Antonius & Turowski, Jens. (2017). Deriving principle channel metrics from bank and long-profile geometry with the R-package cmgo. Earth Surface Dynamics Discussions. 5. 1-19. 10.5194/esurf-5-557-2017.
[Github - CMGO](https://github.com/AntoniusGolly/cmgo)
<p align="center">
<img src="https://user-images.githubusercontent.com/22159116/222872092-e0b579cc-4f84-4f49-aa53-397785fb9bf2.png" />
<img src="https://user-images.githubusercontent.com/22159116/222872119-7c485ee2-4ffd-413a-9e4f-b043b122d2bb.png" />
<img src="https://user-images.githubusercontent.com/22159116/222872019-12931138-9e10-4e51-aa1e-552e72d09af0.png" />
</p>


