[](https://opensource.org/licenses/BSD-3-Clause)

[](https://github.com/FAU-LMS/bjontegaard/stargazers)


# Bjøntegaard-Delta Interpolation
## Introduction
The Bjøntegaard-Delta (BD) metrics (delta bit rate and delta PSNR) described in [1] are well known metrics to measure the average differences between two rate-distortion (RD) curves. They are based on **cubic-spline interpolation (CSI)** of the RD curves and [Matlab](https://www.mathworks.com/matlabcentral/fileexchange/41749-bjontegaard-metric-calculation-bd-psnr) as well as [Python](https://github.com/google/compare-codecs/blob/master/lib/visual_metrics.py) implementations are available on the internet.
However, this way of interpolation using a third-order polynomial leads to problems for certain RD curve constellations and causes very misleading results.
This has also been experienced during the standardization of HEVC.
Consequently, the so-called **piecewise cubic hermite interpolation (PCHIP)** has been implemented in the JCT-VC Common Test Conditions (CTC) Excel sheet [[2]](http://phenix.int-evry.fr/jct/doc_end_user/documents/12_Geneva/wg11/JCTVC-L1100-v1.zip) for performance evaluation.
Nevertheless, only this Excel sheet, but no Python implementation is available yet.
Thus, a Python implementation is provided here.
In [[3]](https://jvet-experts.org/doc_end_user/documents/20_Teleconference/wg11/JVET-T2010-v2.zip), the Excel sheet for the state-of-the-art video codec VVC is given.
In our tests, the implementation of PCHIP returns the same value as the Excel-Implementation with an accuracy of at least 10 decimal positions.
The BD can also be calculated for more than four RD points (not yet cross-checked with respective Excel implementations).
In a further study [[4]](https://doi.org/10.48550/arXiv.2202.12565), it was found that **Akima interpolation** returns even more accurate results. An example for corresponding interpolated curves is shown below.
## Install
`bjontegaard` is best installed via pip: `pip install bjontegaard`.
## Usage
Basic example with test data measured using ffmpeg (libx265 with different preset settings) and Akima interpolation:
```python
# Import the package
import bjontegaard as bd
# Test data
rate_anchor = [9487.76, 4593.60, 2486.44, 1358.24]
psnr_anchor = [ 40.037, 38.615, 36.845, 34.851]
rate_test = [9787.80, 4469.00, 2451.52, 1356.24]
psnr_test = [ 40.121, 38.651, 36.970, 34.987]
# Use the package
bd_rate = bd.bd_rate(rate_anchor, psnr_anchor, rate_test, psnr_test, method='akima')
bd_psnr = bd.bd_psnr(rate_anchor, psnr_anchor, rate_test, psnr_test, method='akima')
print(f"BD-Rate: {bd_rate:.4f} %")
print(f"BD-PSNR: {bd_psnr:.4f} dB")
```
This package provides two main functions for BD metric calculation:
* `bd_rate(rate_anchor, dist_anchor, rate_test, dist_test, method, require_matching_points=True, interpolators=False)`
* `bd_psnr(rate_anchor, dist_anchor, rate_test, dist_test, method, require_matching_points=True, interpolators=False)`
The parameters `rate_anchor` and `dist_anchor` describe the rate-distortion points of the anchor, `rate_test` and `dist_test` describe the rate-distortion points of the test codec.
Available interpolation methods:
* `'cubic'`: Cubic spline interpolation
* `'pchip'`: Piecewise cubic hermite interpolation (used in standardizations [[2]](http://phenix.int-evry.fr/jct/doc_end_user/documents/12_Geneva/wg11/JCTVC-L1100-v1.zip), [[3]]((https://jvet-experts.org/doc_end_user/documents/20_Teleconference/wg11/JVET-T2010-v2.zip)))
* `'akima'`: Akima interpolation [[4]](https://doi.org/10.48550/arXiv.2202.12565)
If `require_matching_points=True` (default), the number of rate-distortion points for anchor and test must match.
If `interpolators=True` is given, the functions additionally return the internal interpolation objects that can be used to check the behaviour of the value interpolation.
## Relative curve difference plots (RCD-plots)
For in-depth evaluation of codec comparison results, we recommend to take relative curve difference plots (RCD-plots) into account.
They can be created using:
* `plot_rcd(rate_anchor, dist_anchor, rate_test, dist_test, method, require_matching_points=True, samples=1000)`
## Comparison behind the scenes
The function `compare_methods` generates a plot that compares the internal interpolation behaviour of the three variants.
The parameters `rate_label`, `distortion_label`, and `figure_label` control the figure and axis labels of the plot.
If `filepath` is given, the final figure is saved to this file.
```python
import bjontegaard as bd
# Test data
rate_anchor = [9487.76, 4593.60, 2486.44, 1358.24]
psnr_anchor = [ 40.037, 38.615, 36.845, 34.851]
rate_test = [9787.80, 4469.00, 2451.52, 1356.24]
psnr_test = [ 40.121, 38.651, 36.970, 34.987]
# Compare the internal behaviour of the three variants
bd.compare_methods(rate_anchor, psnr_anchor, rate_test, psnr_test, rate_label="Rate", distortion_label="PSNR", figure_label="Test 1", filepath=None)
```
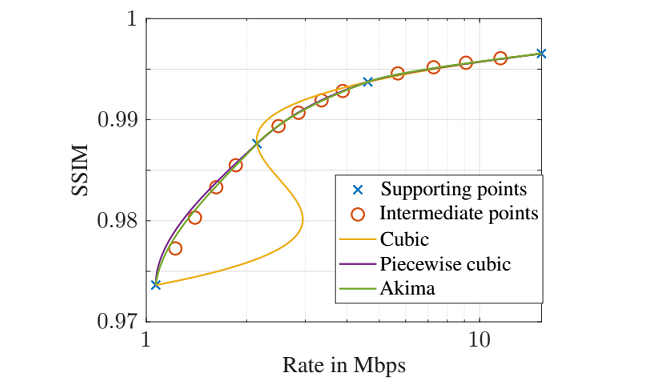
Furthermore, a comparison between the interpolated curves and intermediate, true rate-distortion points between the supporting points is shown in the plot below.
For this example, the quality is represented by the SSIM value. Note that the example was chosen because cubic interpolation fails. Apparently, the curve interpolated by the Akima interpolator is closest to the intermediate points.
## References
[1] G. Bjontegaard, "Calculation of average PSNR differences between RD-curves", VCEG-M33, Austin, TX, USA, April 2001. <br/>
[2] F. Bossen, "Common HM test conditions and software reference configurations", JCTVC-L1100, Geneva, Switzerland, April 2013. <br/>
[3] F. Bossen, "VTM common test conditions and software reference configurations for SDR video", JVET-T2020, Teleconference, October 2020. <br/>
[4] C. Herglotz, M. Kränzler, R. Mons, A. Kaup, "Beyond Bjontegaard: Limits of Video Compression Performance Comparisons", submitted to ICIP 2022, [preprint](https://doi.org/10.48550/arXiv.2202.12565) available. <br/>
## License
BSD 3-Clause. For details, see [LICENSE](https://github.com/FAU-LMS/bjontegaard/blob/main/LICENSE).


