# Ansible Playbook Grapher

[](https://badge.fury.io/py/ansible-playbook-grapher)
[](https://coveralls.io/github/haidaraM/ansible-playbook-grapher?branch=main)
[ansible-playbook-grapher](https://github.com/haidaraM/ansible-playbook-grapher) is a command line tool to create a
graph representing your Ansible playbook plays, tasks and roles. The aim of this project is to have an overview of your
playbook.
Inspired by [Ansible Inventory Grapher](https://github.com/willthames/ansible-inventory-grapher).
## Features
The following features are available when opening the SVGs in a browser (recommended) or a viewer that supports
JavaScript:
- Highlighting of all the related nodes of a given node when clicking or hovering. Example: Click on a role to select
all its tasks when `--include-role-tasks` is set.
- A double click on a node opens its corresponding file or folders depending on if it's the playbook, a play, a task or
a role. By default, the browser will open folders and download files since it may not be able to render the YAML
file.
Optionally, you can
set [the open protocol to use VSCode](https://code.visualstudio.com/docs/editor/command-line#_opening-vs-code-with-urls)
with `--open-protocol-handler vscode`: it will open the folders when double-clicking on roles (not `include_role`) and
the files for the others nodes. The cursor will be at the task exact position in the file.
Lastly, you can provide your own protocol formats
with `--open-protocol-handler custom --open-protocol-custom-formats '{}'`. See the help
and [an example.](https://github.com/haidaraM/ansible-playbook-grapher/blob/main/ansibleplaybookgrapher/renderer.py#L27)
- Filer tasks based on tags
- Export the dot file using to generate the graph with Graphviz.
## Prerequisites
- Python 3.8 at least
- A virtual environment from which to run the grapher. This is **highly recommended** because the grapher depends on
some versions of ansible-core which are not necessarily installed in your environment and may cause issues if you use
some older versions of Ansible (
since `ansible` [package has been split](https://www.ansible.com/blog/ansible-3.0.0-qa)).
- **Graphviz**: The tool used to generate the graph in SVG.
```shell script
$ sudo apt-get install graphviz # or yum install or brew install
```
I try to respect [Red Hat Ansible Engine Life Cycle](https://access.redhat.com/support/policy/updates/ansible-engine)
for the supported Ansible version.
## Installation
```shell script
pip install ansible-playbook-grapher
```
## Usage
```shell
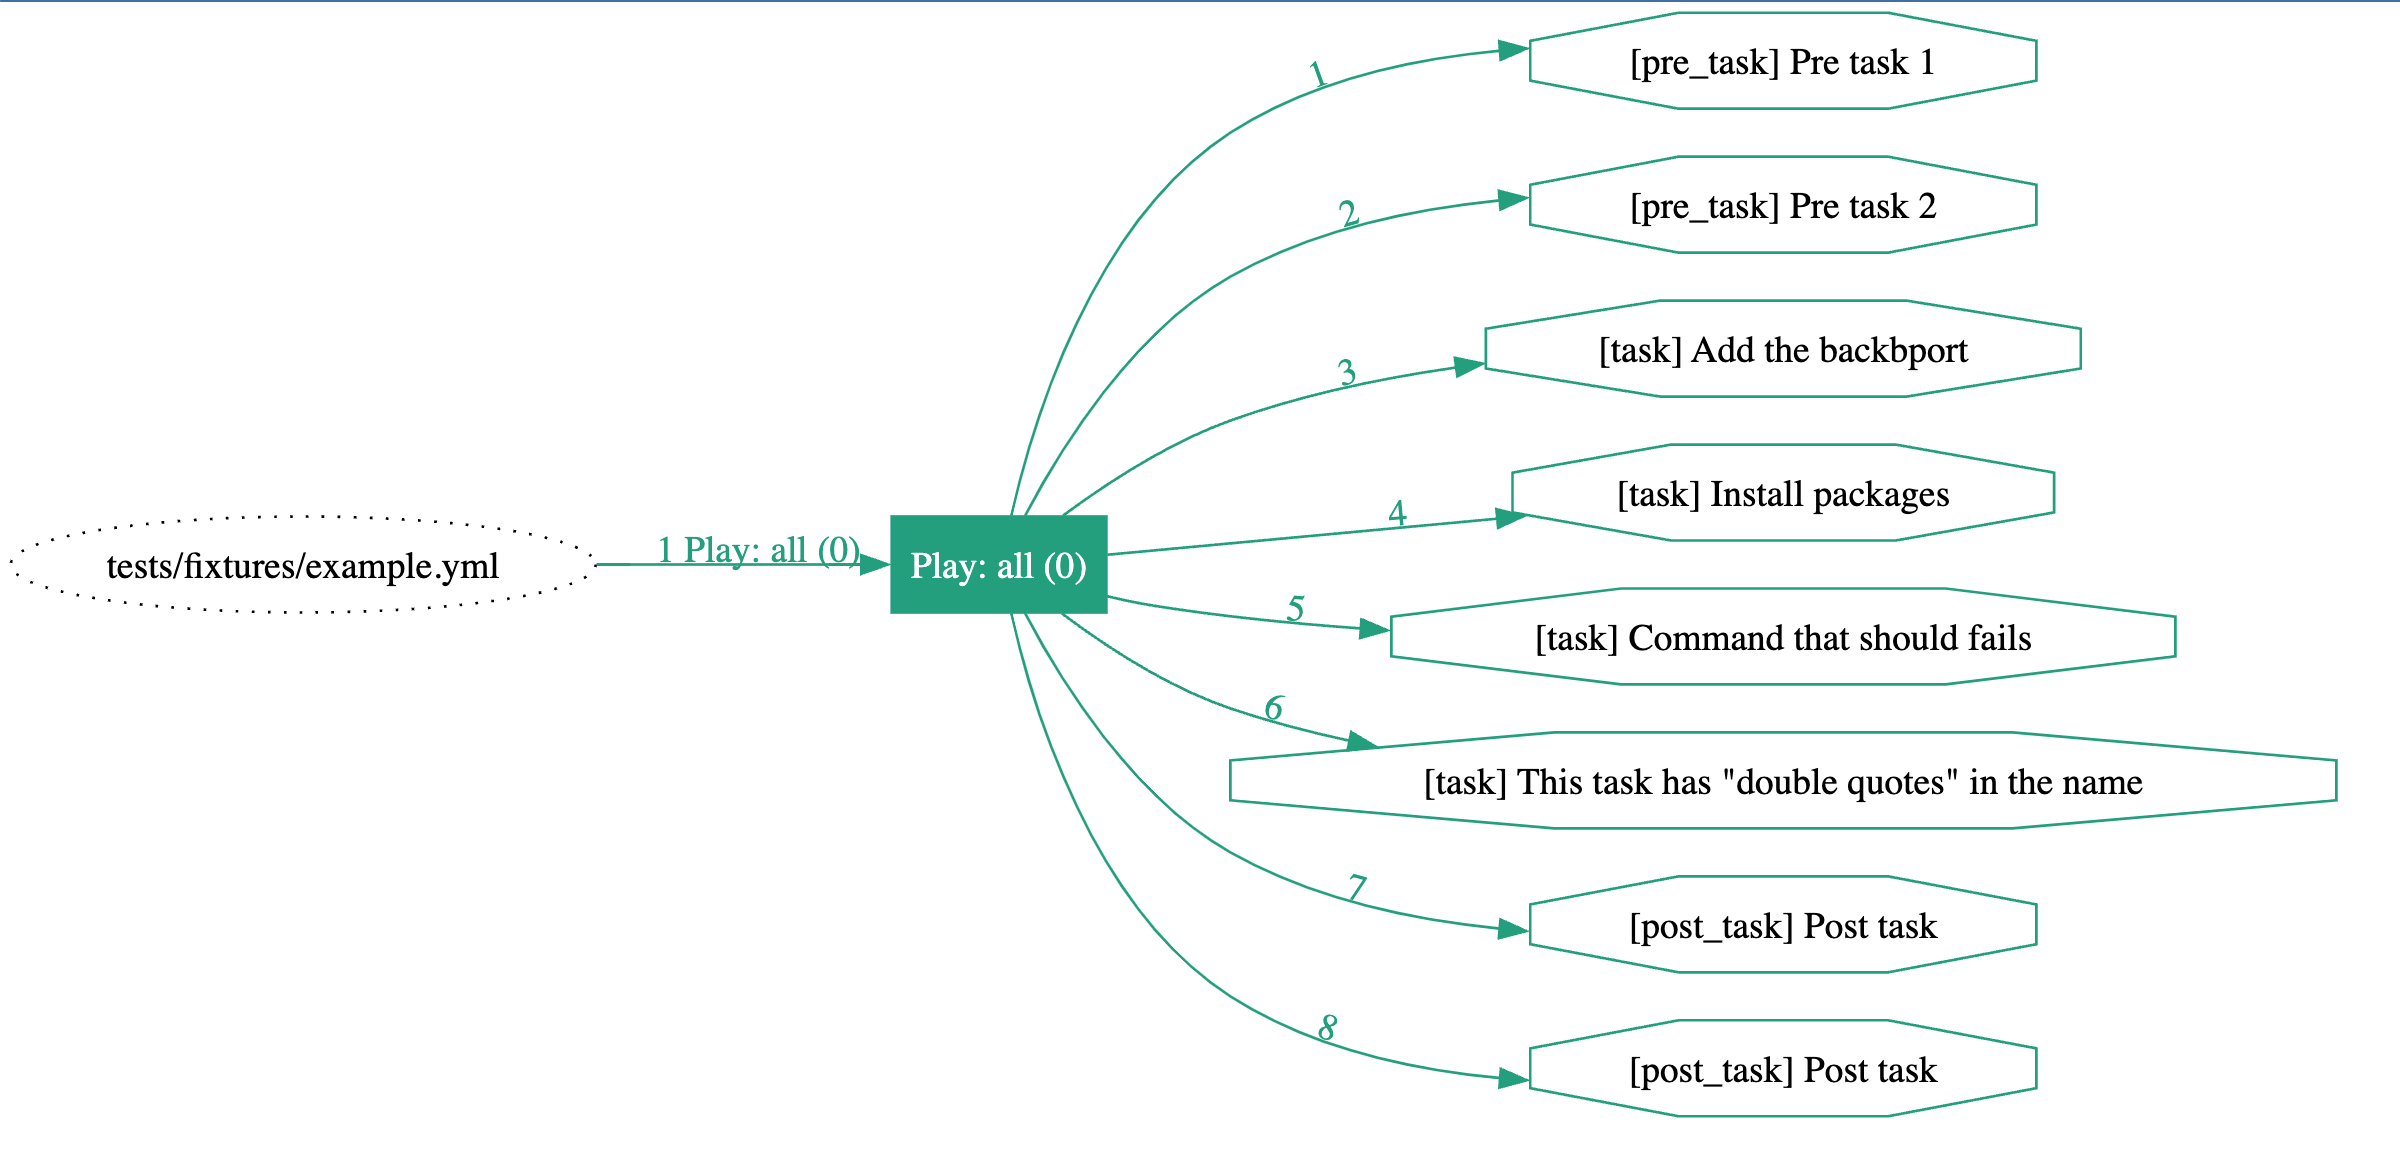
ansible-playbook-grapher tests/fixtures/example.yml
```
```bash
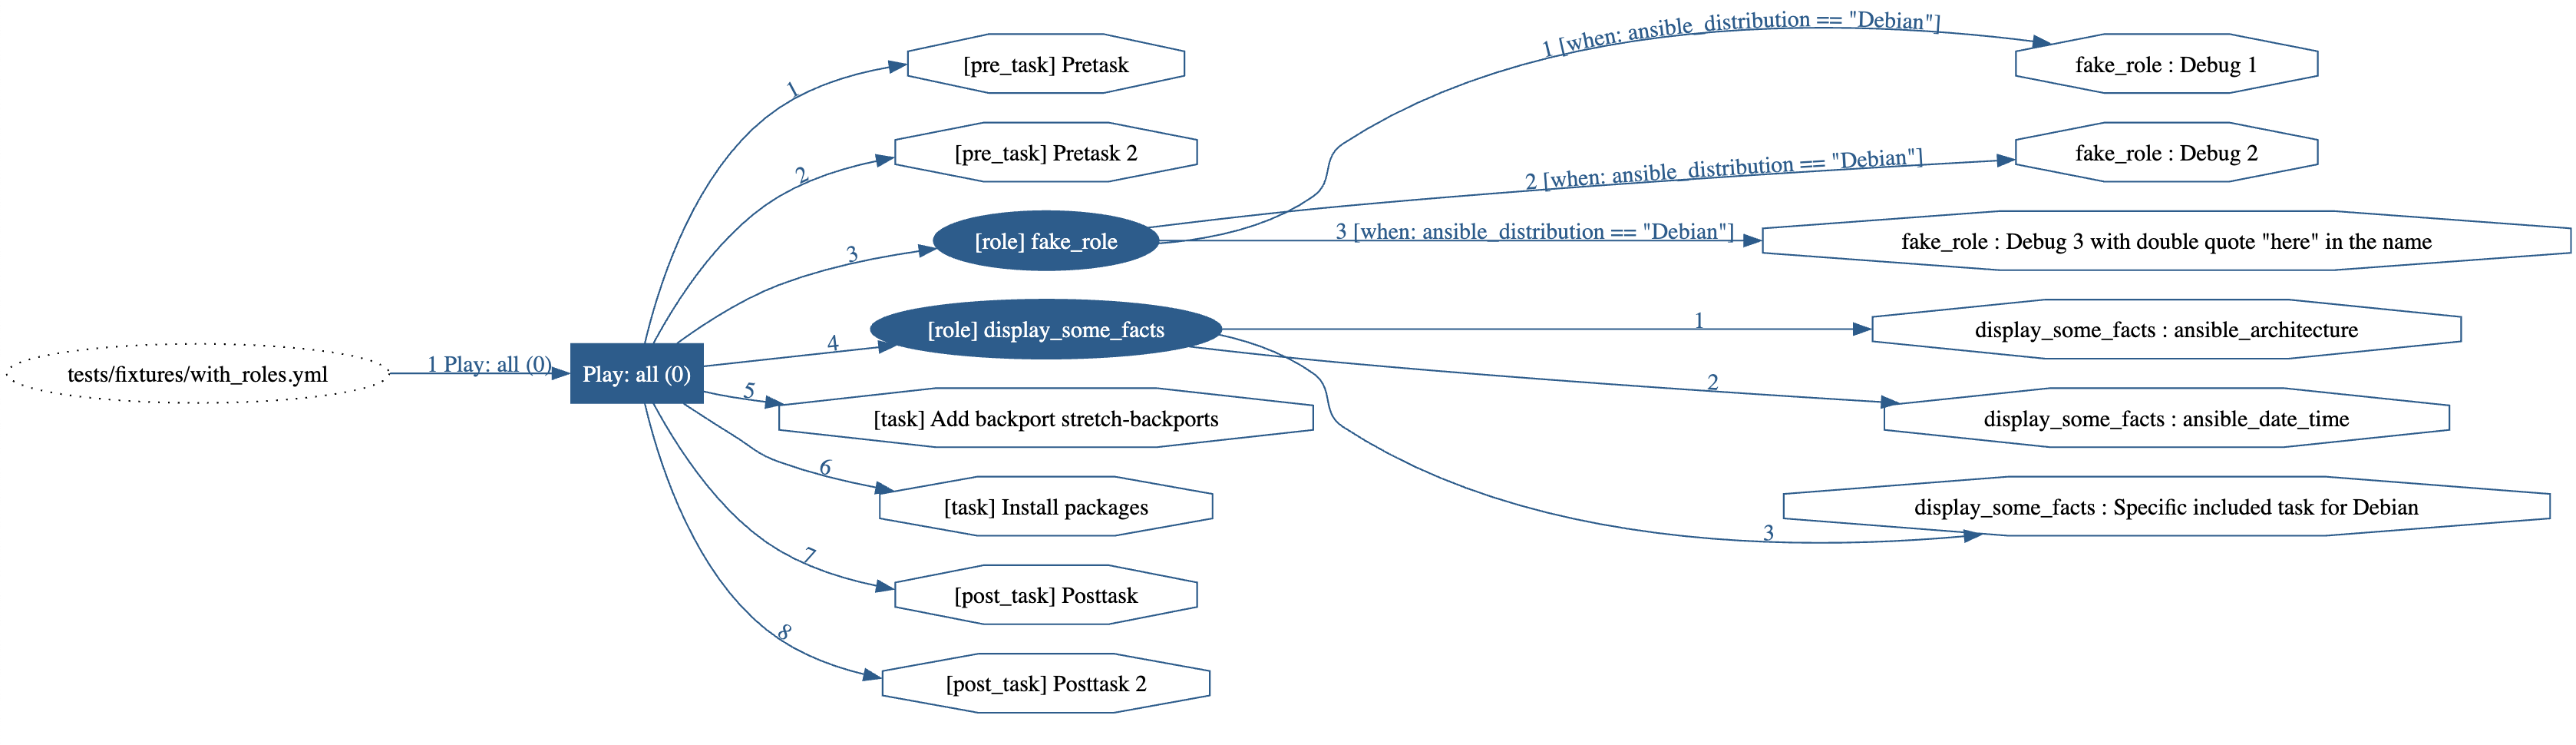
ansible-playbook-grapher --include-role-tasks tests/fixtures/with_roles.yml
```
```bash
ansible-playbook-grapher tests/fixtures/with_block.yml
```
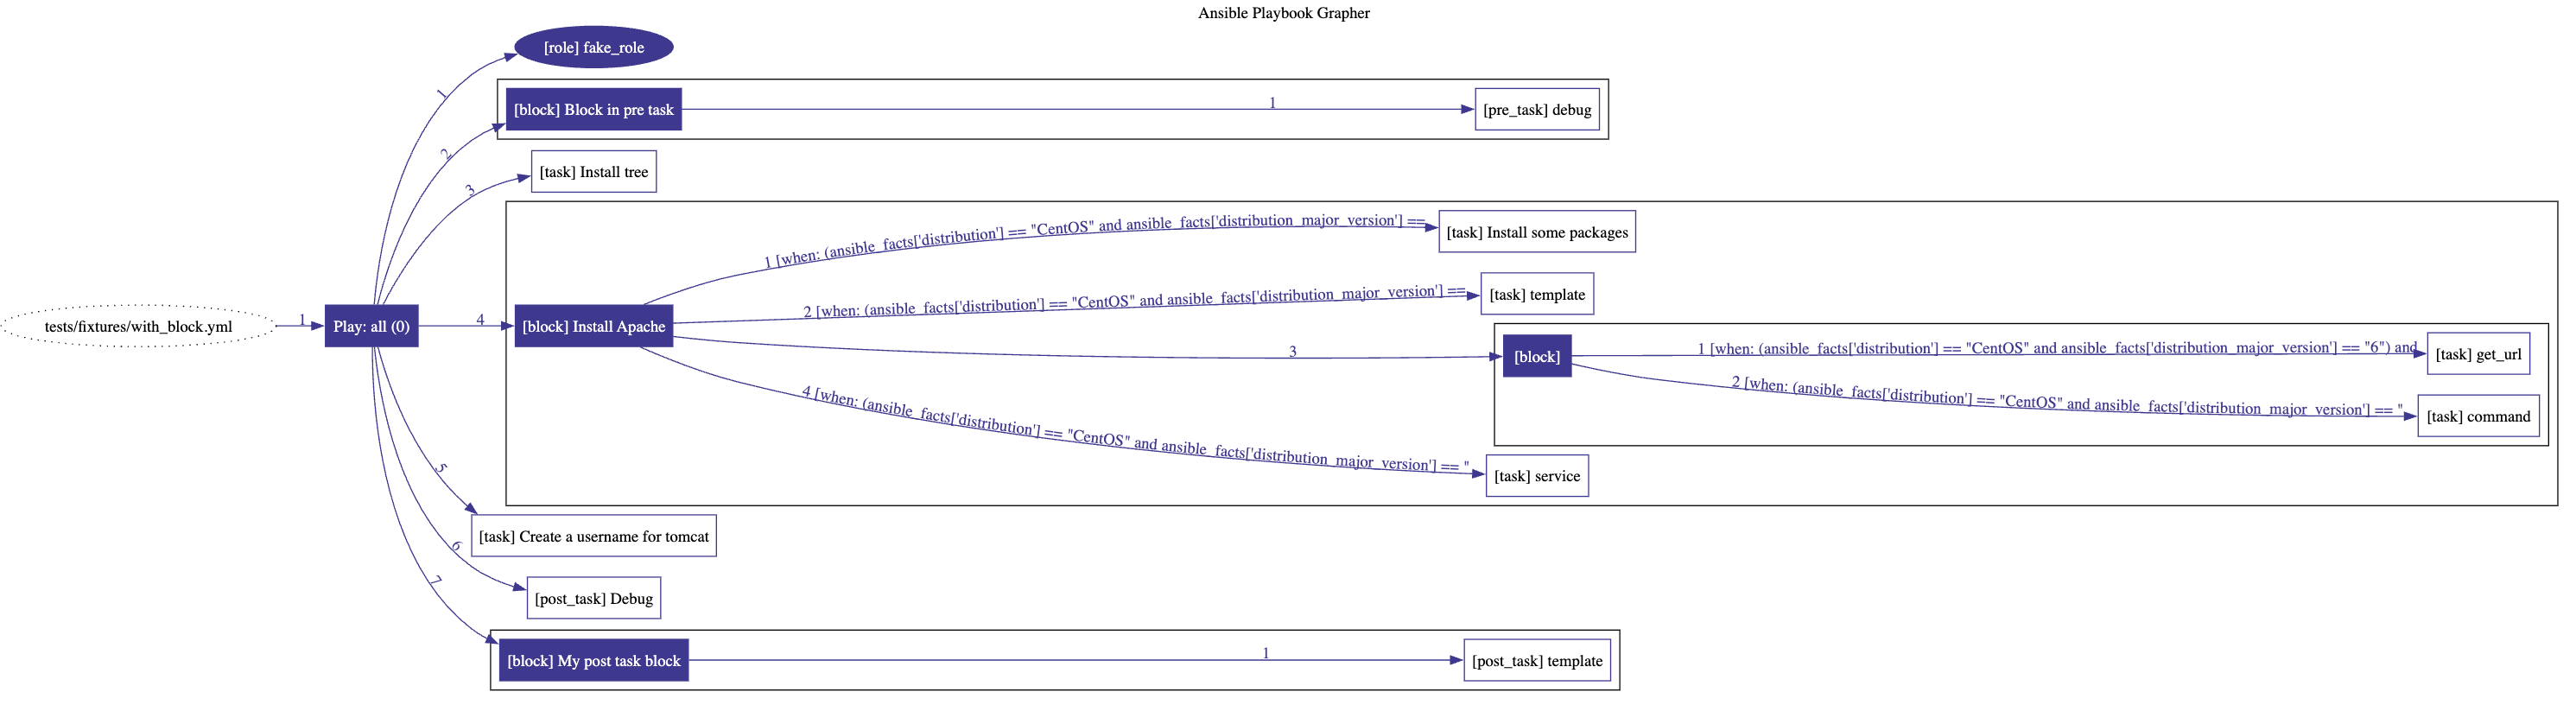
Note on block: Since `block`s are logical group of tasks, the conditional `when` is not displayed on the edges pointing
to them but on the tasks inside the block. This
mimics [Ansible behavior](https://docs.ansible.com/ansible/latest/user_guide/playbooks_blocks.html#grouping-tasks-with-blocks)
regarding the blocks.
### CLI options
The available options:
```
usage: ansible-playbook-grapher [-h] [-v] [-i INVENTORY]
[--include-role-tasks] [-s] [--view]
[-o OUTPUT_FILENAME]
[--open-protocol-handler {default,vscode,custom}]
[--open-protocol-custom-formats OPEN_PROTOCOL_CUSTOM_FORMATS]
[--group-roles-by-name] [--version] [-t TAGS]
[--skip-tags SKIP_TAGS] [--vault-id VAULT_IDS]
[--ask-vault-password | --vault-password-file VAULT_PASSWORD_FILES]
[-e EXTRA_VARS]
playbooks [playbooks ...]
Make graphs from your Ansible Playbooks.
positional arguments:
playbooks Playbook(s) to graph
optional arguments:
--ask-vault-password, --ask-vault-pass
ask for vault password
--group-roles-by-name
When rendering the graph, only a single role will be
display for all roles having the same names.
--include-role-tasks Include the tasks of the role in the graph.
--open-protocol-custom-formats OPEN_PROTOCOL_CUSTOM_FORMATS
The custom formats to use as URLs for the nodes in the
graph. Required if --open-protocol-handler is set to
custom. You should provide a JSON formatted string
like: {"file": "", "folder": ""}. Example: If you want
to open folders (roles) inside the browser and files
(tasks) in vscode, set this to '{"file":
"vscode://file/{path}:{line}:{column}", "folder":
"{path}"}'
--open-protocol-handler {default,vscode,custom}
The protocol to use to open the nodes when double-
clicking on them in your SVG viewer. Your SVG viewer
must support double-click and Javascript. The
supported values are 'default', 'vscode' and 'custom'.
For 'default', the URL will be the path to the file or
folders. When using a browser, it will open or
download them. For 'vscode', the folders and files
will be open with VSCode. For 'custom', you need to
set a custom format with --open-protocol-custom-
formats.
--skip-tags SKIP_TAGS
only run plays and tasks whose tags do not match these
values
--vault-id VAULT_IDS the vault identity to use
--vault-password-file VAULT_PASSWORD_FILES, --vault-pass-file VAULT_PASSWORD_FILES
vault password file
--version show program's version number and exit
--view Automatically open the resulting SVG file with your
system’s default viewer application for the file type
-e EXTRA_VARS, --extra-vars EXTRA_VARS
set additional variables as key=value or YAML/JSON, if
filename prepend with @
-h, --help show this help message and exit
-i INVENTORY, --inventory INVENTORY
specify inventory host path or comma separated host
list.
-o OUTPUT_FILENAME, --output-file-name OUTPUT_FILENAME
Output filename without the '.svg' extension. Default:
<playbook>.svg
-s, --save-dot-file Save the dot file used to generate the graph.
-t TAGS, --tags TAGS only run plays and tasks tagged with these values
-v, --verbose verbose mode (-vvv for more, -vvvv to enable
connection debugging)
```
## Configuration: ansible.cfg
The content of `ansible.cfg` is loaded automatically when running the grapher according to Ansible's behavior. The
corresponding environment variables are also loaded.
The values in the config file (and their corresponding environment variables) may affect the behavior of the grapher.
For example `TAGS_RUN` and `TAGS_SKIP` or vault configuration.
More information [here](https://docs.ansible.com/ansible/latest/reference_appendices/config.html).
## Limitations
- Since Ansible Playbook Grapher is a static analyzer that parses your playbook, it's limited to what can be determined
statically: no task is run against your inventory. The parser tries to interpolate the variables, but some of them are
only available when running your playbook (
ansible_os_family, ansible_system, etc.). The tasks inside any `import_*` or `include_*` with some variables in their
arguments may not appear in the graph.
- The rendered SVG graph may sometime display tasks in a wrong order. I cannot control this behavior of Graphviz yet.
Always check the edge label to know the tasks order.
- The label edge may overlap with each other. The edge labels are positioned so that they are as close as possible to
the target nodes. If a single role is used in multiple plays or playbooks, this can happen.
## Contribution
Contributions are welcome. Feel free to contribute by creating an issue or submitting a PR :smiley:
### Dev environment
To setup a new development environment :
- Install graphviz (see above)
- (cd tests && pip install -r requirements_tests.txt)
Run the tests and open the generated files in your system’s default viewer application:
```shell script
export TEST_VIEW_GENERATED_FILE=1
$ make test # run all tests
```
The graphs are generated in the folder `tests/generated_svg`. They are also generated as artefacts
in [Github Actions](https://github.com/haidaraM/ansible-playbook-grapher/actions). Feel free to look at them when
submitting PRs.
## License
GNU General Public License v3.0 or later (Same as Ansible)
See [LICENSE](./LICENSE) for the full text


