# EHRQC
## Introduction
The performance of the Machine Learning (ML) models is primarily dependent on the underlying data on which it is trained on. Therefore, it is very essential to ensure that the training data is of the highest quality possible. It is a standard practice to perform operations related to handling of the missing values, and outliers before feeding it to machine learning algorithms, for which there are well established procedures and dedicated libraries currently. However, they are generic in nature and do not cover the domain specific nuances. For instance, non standard data sanity checks are to be performed in addition, to remove further errors in the Electronic Health Records (EHRs) that are specific to the medical domain. This utility is aimed at providing functions that can summarize the errors that are specific to the healthcare domain in the data through various visualizations.
## System architecture
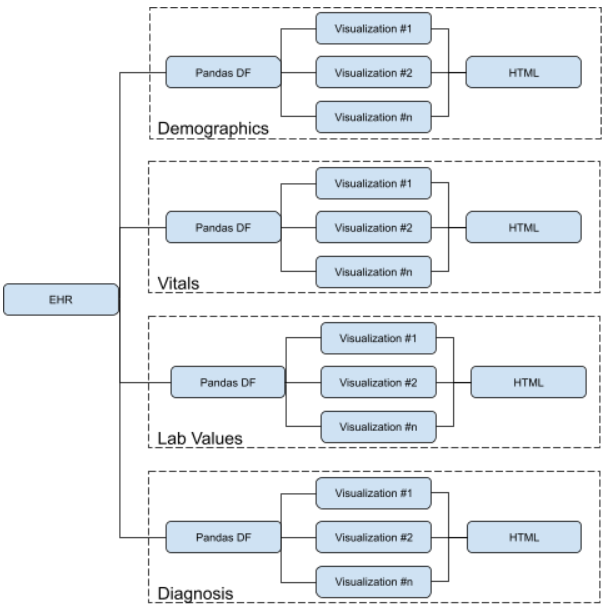
## Example Output
Refer [demographics.html](https://github.com/ryashpal/EHRQC/blob/master/demographics.html), [vitals.html](https://github.com/ryashpal/EHRQC/blob/master/vitals.html), [lab_measurements.html](https://github.com/ryashpal/EHRQC/blob/master/lab_measurements.html), [vitals_anomalies.html](https://github.com/ryashpal/EHRQC/blob/master/vitals_anomalies.html), and [lab_measurements_anomalies.html](https://github.com/ryashpal/EHRQC/blob/master/lab_measurements_anomalies.html)
## Installation Guide
Install the following libraries
pip install numpy
pip install matplotlib
pip install yattag
pip install scipy
pip install sklearn
pip install pandas
Then install EHRQC
pip install EHRQC
## User Guide
### Extract Demographic data from OMOP schema
from qc.extract import extractOmopDemographics as extractOmopDemographics
omopDemographicsDf = extractOmopDemographics()
omopDemographicsDf.head()
### Extract Vitals data from OMOP schema
from qc.extract import extractMimicOmopVitals as extractMimicOmopVitals
mimicOmopVitalsDf = extractMimicOmopVitals()
mimicOmopVitalsDf.head()
### Extract Lab Measurements data from OMOP schema
from qc.extract import extractOmopLabMeasurements as extractOmopLabMeasurements
omopLabMeasurementsDf = extractOmopLabMeasurements()
omopLabMeasurementsDf.head()
### Extract Demographic data from MIMIC schema
from qc.extract import extractMimicDemographics as extractMimicDemographics
mimicDemographicsDf = extractMimicDemographics()
mimicDemographicsDf.head()
### Extract Vitals data from MIMIC schema
from qc.extract import extractMimicVitals as extractMimicVitals
mimicVitalsDf = extractMimicVitals()
mimicVitalsDf.head()
### Extract Lab Measurements data from MIMIC schema
from qc.extract import extractMimicLabMeasurements as extractMimicLabMeasurements
mimicLabMeasurementsDf = extractMimicLabMeasurements()
mimicLabMeasurementsDf.head()
### Demographics Graphs Example 1
import qc.demographicsGraphs as demographicsGraphs
data = [
[0, 1, 2, 'male', 'white', date.fromisoformat('2020-09-13'), date.fromisoformat('2021-09-13')],
[2, 3, 4, np.nan, 'white', date.fromisoformat('2020-09-14'), date.fromisoformat('2021-09-13')],
[4, 5, 6, 'female', 'black', date.fromisoformat('2020-09-15'), date.fromisoformat('2021-09-13')],
[6, 7, 8, np.nan, 'asian', date.fromisoformat('2020-09-14'), date.fromisoformat('2021-09-13')]]
demographicsGraphs.plot(pd.DataFrame(data, columns=['age', 'weight', 'height', 'gender', 'ethnicity', 'dob', 'dod']))
### Demographics Graphs Example 2
import qc.demographicsGraphs as demographicsGraphs
df = dbUtils._getDemographics()
demographicsGraphs.plot(df)
### Vitals Graphs Example 1
import qc.vitalsGraphs as vitalsGraphs
data = [
[0, 1, 2],
[2, np.nan, 4],
[4, 5, np.nan],
[0, 1, 2],
[2, 3, 4],
[4, 5, np.nan],
[0, 1, 2],
[2, 3, 4],
[4, 5, 6],
[6, 7, np.nan]]
vitalsGraphs.plot(pd.DataFrame(data, columns=['heartrate', 'sysbp', 'diabp']))
### Vitals Graphs Example 2
import qc.vitalsGraphs as vitalsGraphs
df = dbUtils._getVitals()
vitalsGraphs.plot(df)
### Lab Measurements Graphs Example 1
import qc.labMeasurementsGraphs as labMeasurementsGraphs
data = [
[0, 1, 2],
[2, np.nan, 4],
[4, 5, np.nan],
[0, 1, 2],
[2, 3, 4],
[4, 5, np.nan],
[0, 1, 2],
[2, 3, 4],
[4, 5, 6],
[6, 7, np.nan]]
labMeasurementsGraphs.plot(pd.DataFrame(data, columns=['glucose', 'hemoglobin', 'anion_gap']))
### Lab Measurements Graphs Example 2
import qc.labMeasurementsGraphs as labMeasurementsGraphs
df = dbUtils._getLabMeasurements()
labMeasurementsGraphs.plot(df)
### Missing Data Imputation Method Comparison Example 1
import qc.missingDataImputation as missingDataImputation
df = dbUtils._getVitals()
df = df.dropna()
meanR2, medianR2, knnR2, mfR2, emR2, miR2 = missingDataImputation.compare()
print(meanR2, medianR2, knnR2, mfR2, emR2, miR2)
### Missing Data Imputation Method Comparison Example 2
import qc.missingDataImputation as missingDataImputation
df = dbUtils._getLabMeasurements()
df = df.dropna()
meanR2, medianR2, knnR2, mfR2, emR2, miR2 = missingDataImputation.compare()
print(meanR2, medianR2, knnR2, mfR2, emR2, miR2)
### Missing Data Imputation Example 1
import qc.missingDataImputation as missingDataImputation
df = dbUtils._getVitals()
imputedDf = missingDataImputation.impute(df, 'miss_forest')
### Vitals Anomaly Graphs Example
import qc.vitalsAnomalies as vitalsAnomalies
df = dbUtils._getVitals()
vitalsAnomalies.plot(df)
### Lab Measurements Anomaly Graphs Example
import qc.labMeasurementsAnomalies as labMeasurementsAnomalies
df = dbUtils._getVitals()
labMeasurementsAnomalies.plot(df)
### Running the Pipeline Example
from qc.pipeline import run
data = run(source='mimic', type='demographics', graph=True, impute_missing=True)
print(data.head())
## source -> Can be one of 'mimic' or 'omop'
## type -> Can be one of 'demographics', 'vitals', 'lab_measurements'
## graph -> If true, the EDA graph will be generated
## impute_missing -> If true, missing values will be imputed based on the best imputation method for the given data
## Acknowledgements
<img src="https://user-images.githubusercontent.com/56529301/155898403-c453ab3f-df17-45c8-ac0a-b314461f5e8f.png" alt="the-alfred-hospital-logo" width="100"/>
<img src="https://user-images.githubusercontent.com/56529301/155898442-ba8dcbb1-14dd-4c8b-96e6-e02c6a632c0e.png" alt="the-alfred-hospital-logo" width="150"/>
<img src="https://user-images.githubusercontent.com/56529301/155898475-a5244ab5-e16e-4e5d-b562-6a89a7c2b7b7.png" alt="Superbug_AI_Branding_FINAL" width="150"/>


